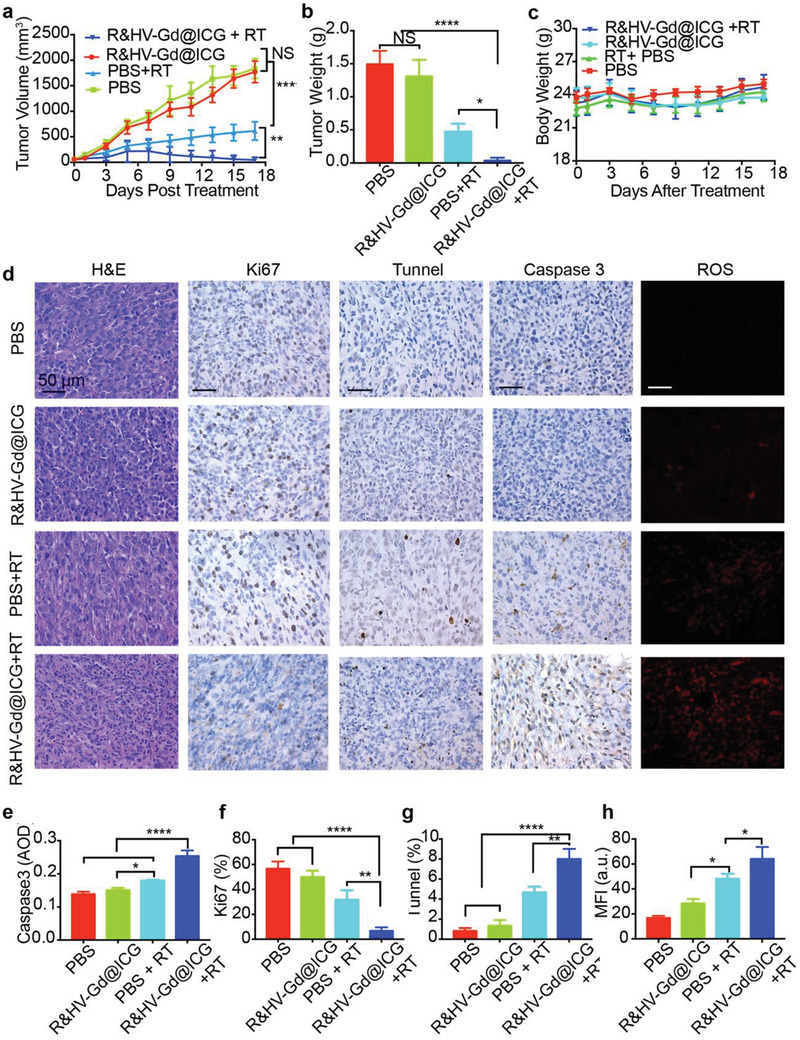
Figure 8.

Radiosensitization of R&HV‐Gd@ICG in 4T1‐tumor‐bearing mice. a) Tumor growth curves for mice treated with R&HV‐Gd@ICG and PBS with or without X‐ray RT (n = 4). Treatments were conducted on days 0 and 6, and each exposure was 6 Gy. b) Tumor weight after different treatments at day 17 (n = 4). c) Bodyweight curves for mice treated with R&HV‐Gd@ICG and PBS with or without irradiation (n = 4). d) H&E staining, Ki67, TUNEL, and Caspase3 IHC staining images of tumor slices and ROS immunofluorescence images of tumor slices after various treatments. Corresponding quantitative analyses of e) Caspase 3, f) Ki‐67, g) TUNEL, and h) ROS fluorescent staining after different treatments (n = 3). Data were shown as means ± SD, statistical significance is assessed using one‐way ANOVA followed by Tukey's multiple comparisons test, *p < 0.05, **p < 0.01, ****p < 0.0001.
