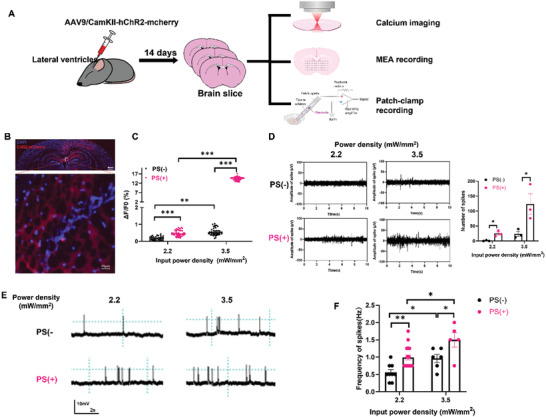
Figure 3.

Microsphere‐based optogenetics in modulating neuron activity in brain slice. A) Schematic illustration of ex vivo experiments for testing microsphere‐based optogenetics. Newborn mice were injected in lateral ventricle with AAV9/CamKII‐hChR2‐mCherry, and brain slice were collected for calcium imaging, MEA recording as well as membrane potential patch‐clamp recording after 14 days virus injection. B) Representative images of ChR2‐mCherry expression in the brain after 14 days virus infection. (Scale bar in large field image: 100 µm; scale bar in enlarged image: 25 µm.) C) Bar chart shows the mean ± SEM of fifty neurons’ Ca2+ fluorescence changes induced by light stimulation. n = 50, ** p < 0.01, *** p < 0.001m, unpaired two‐tailed t‐test. D) Representative traces of light‐induced neuronal activity in brain slice with ChR2 in with or without PS, obtained by MEA recording as well bar chart of the mean ± SEM that show the firing number, n = 3, * p < 0.05 unpaired two‐tailed t‐test. E) Membrane potential recording e after 1 min light stimulation in the brain slice with ChR2 in with or without PS. F) Summary bar graph showing the frequency of neuronal firing after 1 min of light stimulation with or without PS. n = 6–9, * p < 0.05, ** p < 0.01, unpaired two‐tailed t‐test.
