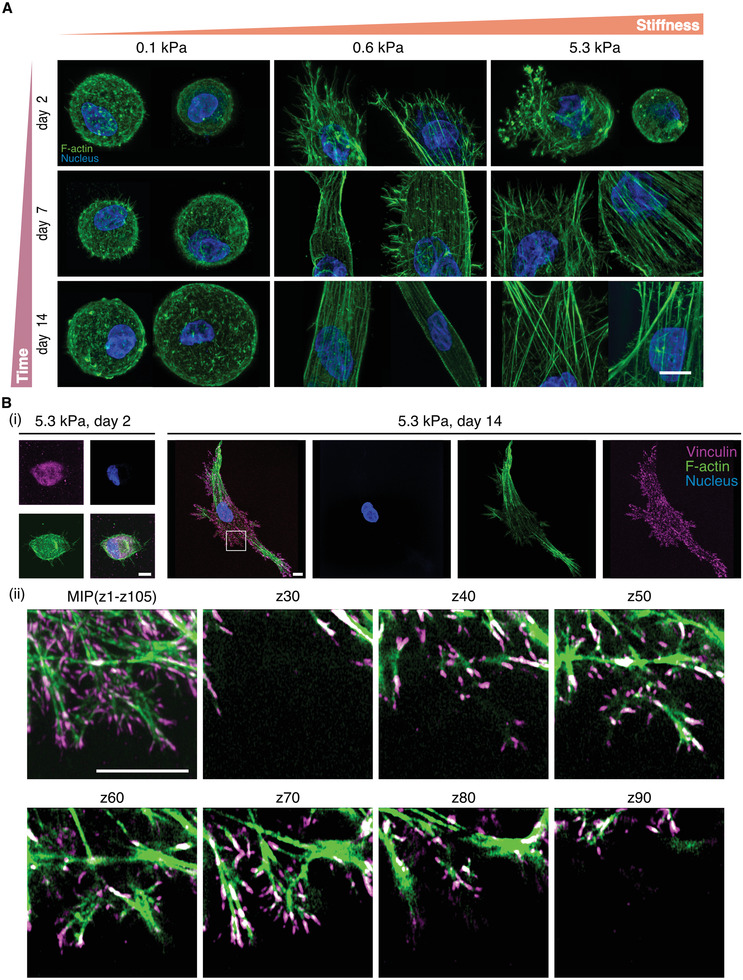
Figure 4.

Actin stress fiber and focal adhesion formation correlate with the spread state of the cell. A) Stress fiber formation in hMSCs cultured within DexVS hydrogels crosslinked with 10.1 × 10⁻³, 16.8 × 10⁻³, and 50.4 × 10⁻³ m MMP‐cleavable peptides for 2, 7, and 14 days. B) Focal adhesion formation, as visualized by antibody staining against vinculin, in hMSCs cultured in 5.3 kPa hydrogels for 2 and 14 days. Images in i) are 3D maximum intensity projections (MIP) of entire cells, whereas ii) shows different z planes of the framed area in i) (images are separated by a step size of 1.92 µm), demonstrating that focal adhesions are fully distributed across all three dimensions. Composite fluorescence images showing F‐actin (green), nuclei (blue) and vinculin (magenta). Scale bar, 10 µm.
