
Figure 3.
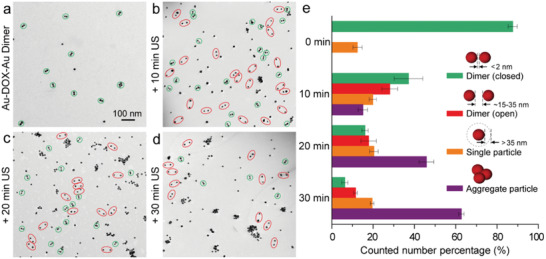
US‐induced structural change of Au‐DOX‐Au dimer nanoswitches. Representative TEM images of a) Au‐DOX‐Au without ultrasonication, Au‐DOX‐Au with ultrasonication for b) 10 min, c) 20 min, and d) 30 min, respectively (green circled: closed; red circled: open). e) The corresponding number percentage histograms of Au‐DOX‐Au with different morphologies after US treatment for 0, 10, 20, and 30 min, respectively. The statistical analysis was repeated with three independent samples. Mean values: SD from the mean, N = 3 independent experiments.