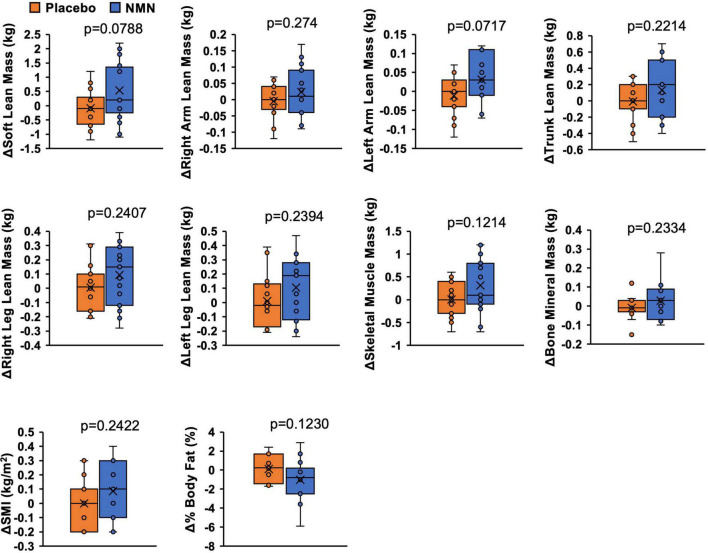
FIGURE 4.
Amount of change of body composition implied increased muscle mass and reduced body fat. Body composition was measured with InBody770 at 0- and 12-week. Value at 0-week was subtracted from value at 12-week to calculate amount of change. Orange represents placebo group (n = 14) and blue represents NMN group (n = 15). Data are represented as mean ± SD. SMI, skeletal muscle mass index.

