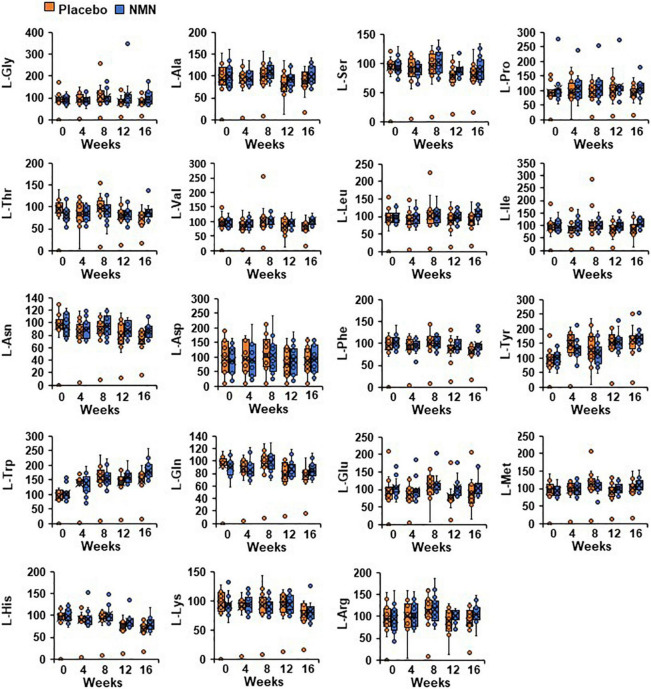
FIGURE 7.
Oral NMN treatment had little effect on blood amino acid levels. Amino acid metabolome in blood was measured every 4 weeks. Amino acid metabolome in each time point was showed in box plots. In the box plots, the median is indicated by the line within the boxes. The lower and upper boundaries of the boxes indicated 25th and 75th percentiles. The upper and lower lines above and below the boxes represent the whiskers. Orange boxes represent placebo group (n = 15 at 0, 4, 8 weeks, n = 14 at 12, 16 weeks) and blue boxes represents NMN group (n = 15).

