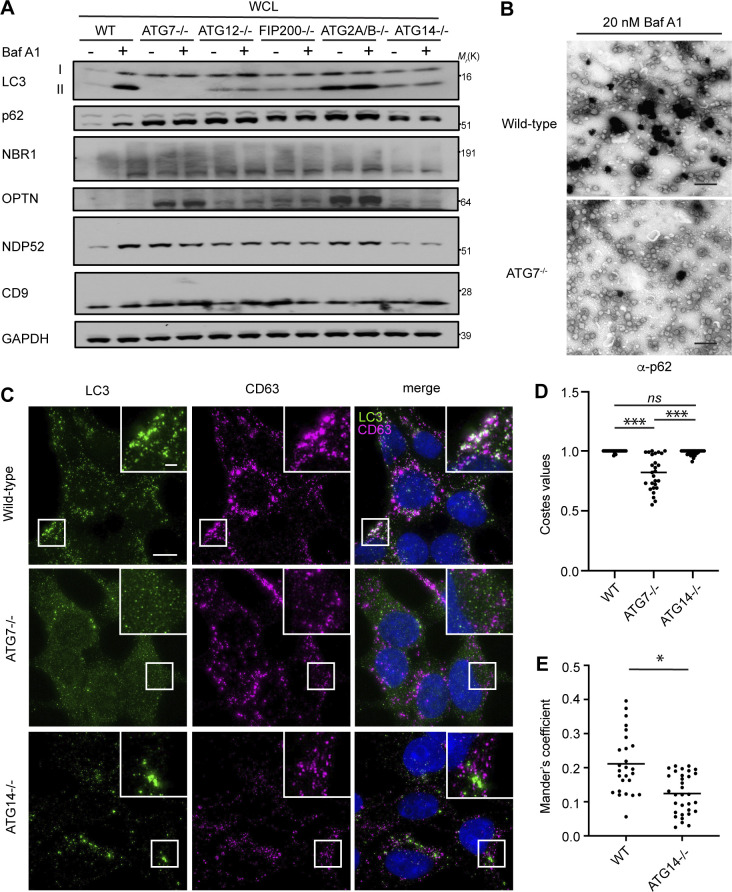
Figure S4.
Autophagosome formation is required for autophagy cargo receptor secretion in response to lysosome inhibition. (A) WCL from serum-starved HEK293Ts of the indicated genotypes treated with or without 20 nM BafA1 and corresponding to secretion experiments in Fig. 5, A and B, were collected and immunoblotted for LC3, autophagy cargo receptors, CD9, and GAPDH. (B) Representative images from transmission EM of small EVPs collected from 20 nM BafA1 treated WT and ATG7−/− cells that were immunostained with primary antibody against p62/SQSTM1 and detected with ultrasmall gold-conjugated secondary antibody with silver enhancement (scale bar, 500 nm). (C) Representative fluorescence micrographs from serum-starved WT, ATG7−/−, and ATG14−/− cells treated with 20 nM BafA1 and immunostained for endogenous LC3 (green), CD63 (magenta), and p62. Immunofluorescence micrographs of endogenous p62 and CD63 from these exact cell samples and corresponding co-occurrence data can be found in Fig. 5, C and D. Scale bar, 10 μm; inset scale bar, 2 μm. (D) A scatter plot of the P values obtained from Costes significance tests to assess whether the overlap of LC3 and CD63 staining observed in C exceeds thresholds of random co-occurrence. Statistical significance was calculated by nonparametric two-way ANOVA with Tukey’s post hoc test (mean ± SEM; WT, n = 26; ATG7−/−, n = 26; ATG14−/−, n = 32; ***, P < 0.005). (E) A scatter plot of Mander’s coefficients for the co-occurrence of LC3 with CD63 in BafA1 treated WT and ATG14−/− cells in C. Statistical significance was calculated by an unpaired two-tailed t test (mean ± SEM; WT, n = 26; ATG14−/−, n = 32; *, P < 0.05). Source data are available for this figure: SourceData FS4.

