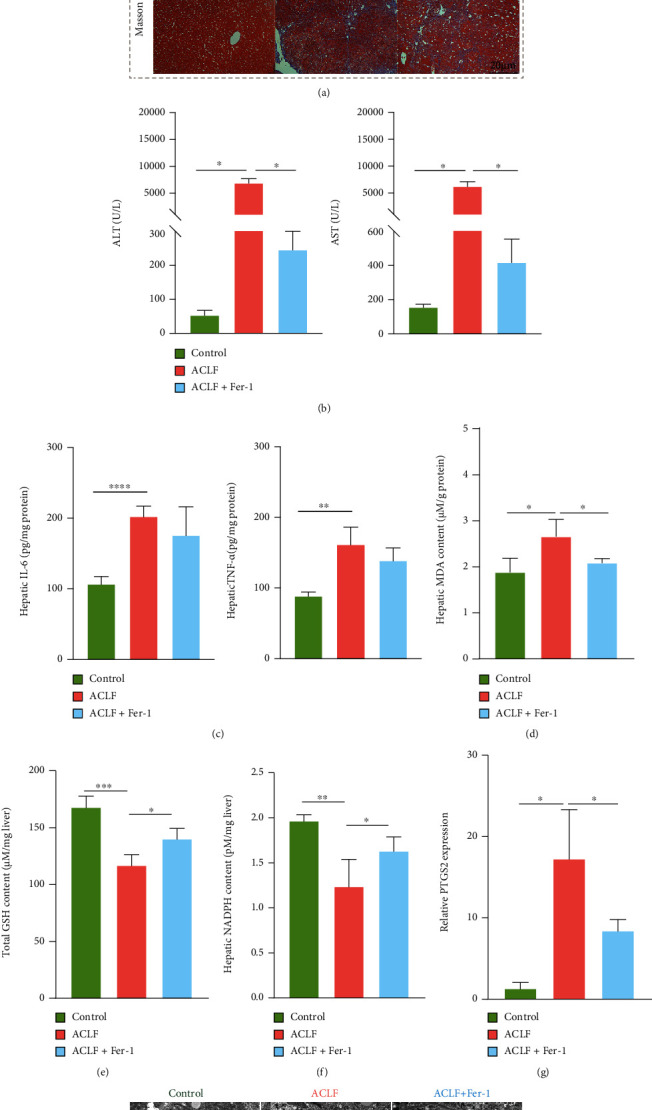
Figure 6.

Repression of ferroptosis attenuates the severity of ACLF in vivo. (a) Representative images of morphological and histopathologic traits. Original magnification ×100 (Bar = 40 μm) and ×200 (Bar = 20 μm). (b) Fer-1 treatment significantly reduced the serum levels of ALT and AST. (c) Inhibition of ferroptosis failed to decrease the hepatic IL-6 and TNF-α concentrations. (d–f) Increased hepatic GSH and NADPH and decreased hepatic MDA were observed in mice treated with Fer-1. (g) The mRNA expression of ferroptosis-related gene PTGS2 was decreased in mice treated with Fer-1. (h) Fer-1 treatment improved ferroptosis-specific mitochondrial morphology. Bar = 10 μm. Black arrows indicate normal mitochondria; red arrows indicate shrunken and ruptured mitochondria. ∗p < 0.05, ∗∗p < 0.01, ∗∗∗p < 0.001, ∗∗∗∗p < 0.0001. n = 3(control), n = 6 (ACLF), n = 5 (ACLF+Fer-1). ALT = alanine aminotransferase; AST = aspartate aminotransferase; ACLF = acute-on-chronic liver failure; Fer-1 = ferrostatin-1; GSH = glutathione; IL-6 = interleukin-6; MDA = malondialdehyde; NADPH = nicotinamide adenine dinucleotide phosphate; PTGS2 = prostaglandin-endoperoxide synthase-2; TNF-α = tumor necrosis factor alpha.
