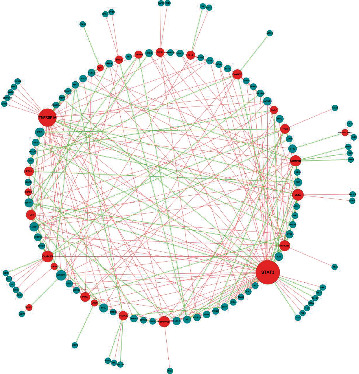
Figure 6.

Transcription factor–necroptosis-related differentially expressed genes (NRDEGs) regulatory network in Stanford type A aortic dissection. The size of the dots reflects the degree, the red dots represent NRDEGs, and the blue dots represent transcription factors. The color of the edge lines in this network represents the correlation: bright red lines indicate a positive correlation, while light green lines indicate a negative correlation.
