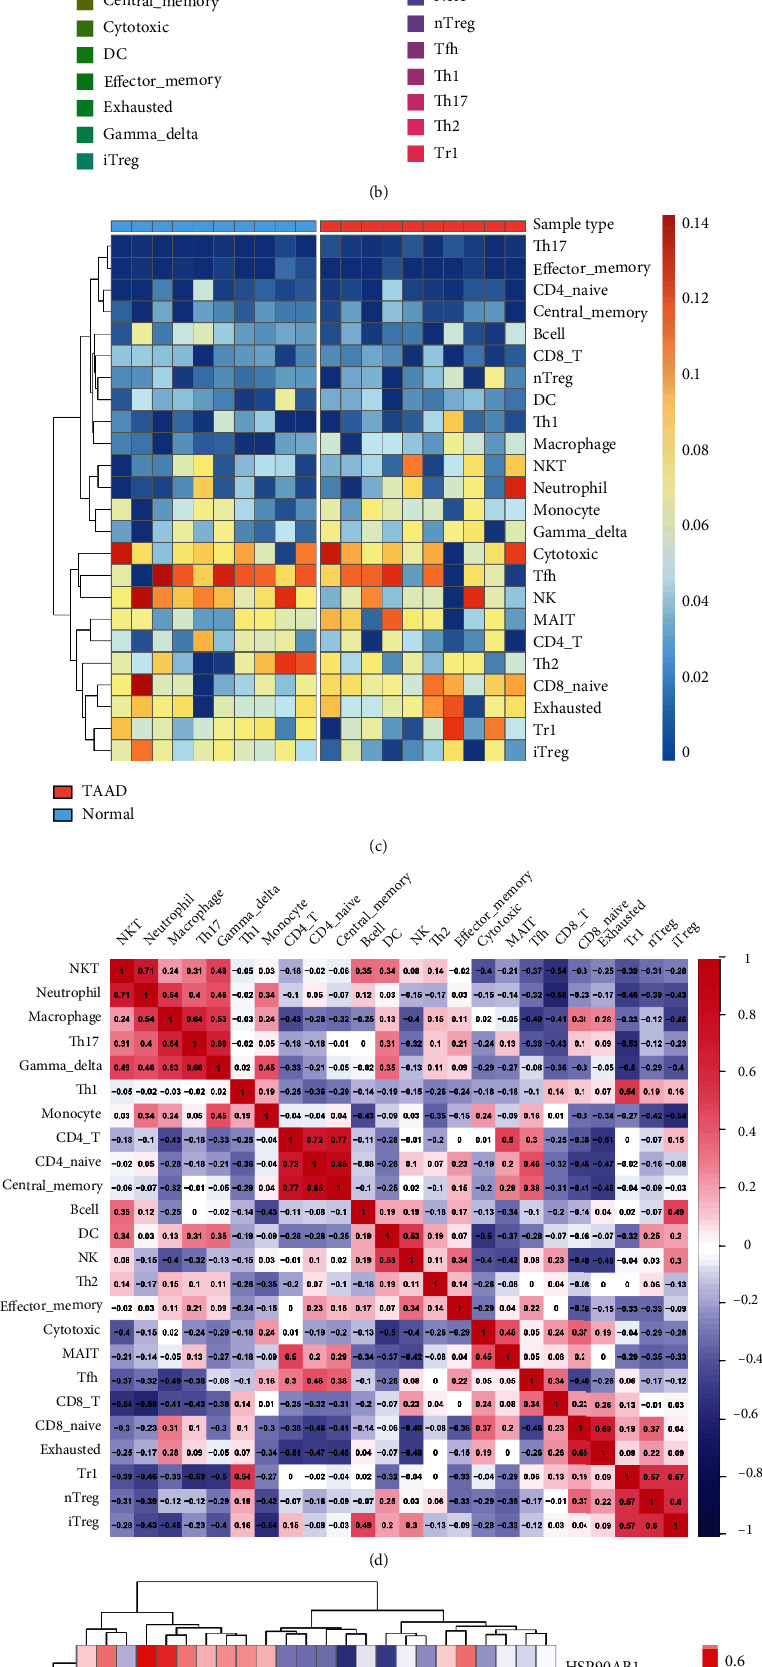
Figure 7.

The landscape of immune infiltration in Stanford type A aortic dissection. (a) The violin plot of the immune cell proportions.(b) Stacked bar chart of the immune cell. (c) Heatmap of the proportions of 24 immune cell types. (d) The correlation matrix of immune cell proportions. (e) The correlation between differentially expressed necroptosis-related genes and immune cells.
