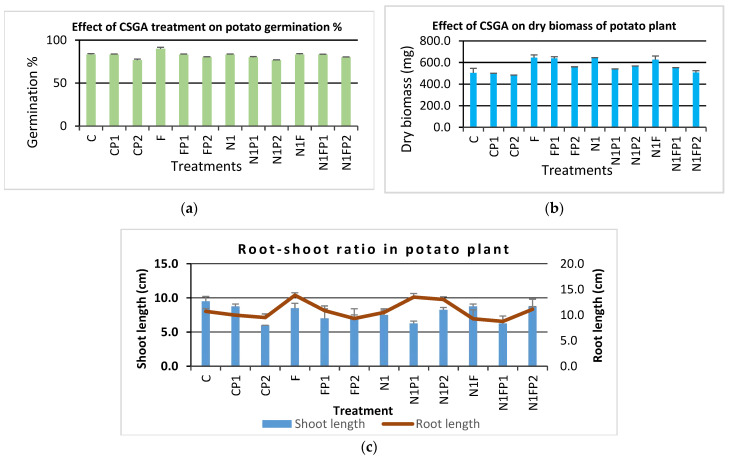
Figure 8.
Effects of NCs on potato plant development characteristics: (a) germination percent; (b) dry biomass per plant; (c) root-shoot ratio; where C—Control, CP1—pathogen P1, F—commercial fungicide, FP1—commercial fungicide + P1, N1—blank NCs, N1P1—pathogen P1 + blank NCs, N1F—mancozeb-loaded NCs, N1FP1—loaded NCs + P1; CP2—pathogen P2, FP2—fungicide + P2, N1P2—blank NCs + P2, N1FP2—mancozeb-loaded NCs + P2; P1 stands for A. solani and P2 for S. sclerotiorum.

