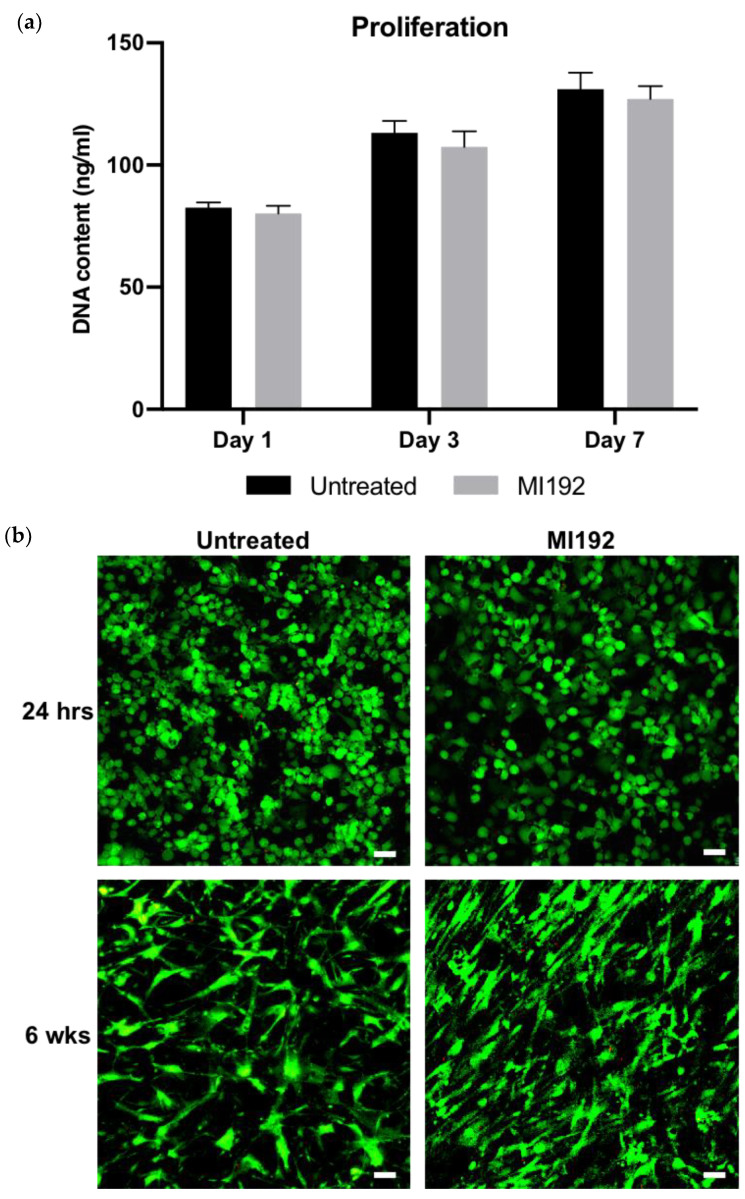
Figure 1.
The effects of MI192 on the proliferation and viability of hBMSCs within GelMA hydrogels. (a) DNA content of MI192-pre-treated/untreated hBMSCs within GelMA hydrogels during basal culture. (b) Merged live/dead staining of encapsulated hBMSCs within GelMA during osteogenic culture (live cells—green; dead cells—red). Scale bars = 50 µm. Data are presented as the mean ± SD (n = 3).

