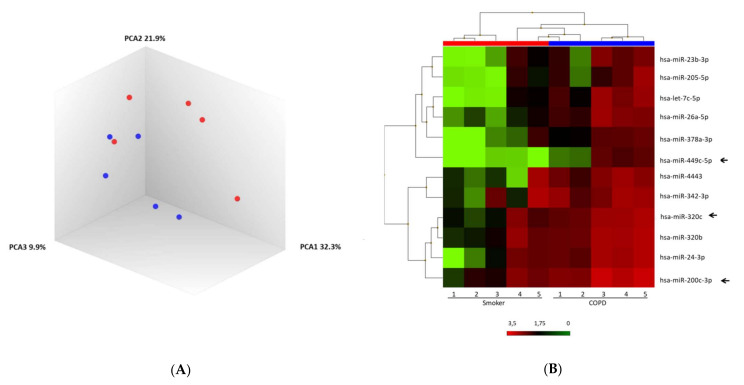
Figure 1.
MiRNA microarray profiling of COPD and smoker. (A) Three-dimensional principal component analysis (PCA) plot showing the normalized signal values of ten expression profiles using BAL samples from chronic obstructive pulmonary disease (COPD) (blue) and smoker (red). (B) Heat map representation of an unsupervised hierarchical clustering of the ten most significant differentially expressed BAL-derived miRNAs in comparison between COPD and smokers. Arrows show miR-320c, miR-200c-3p, and miR-449c-5p as candidates.

