
Fig. 1.
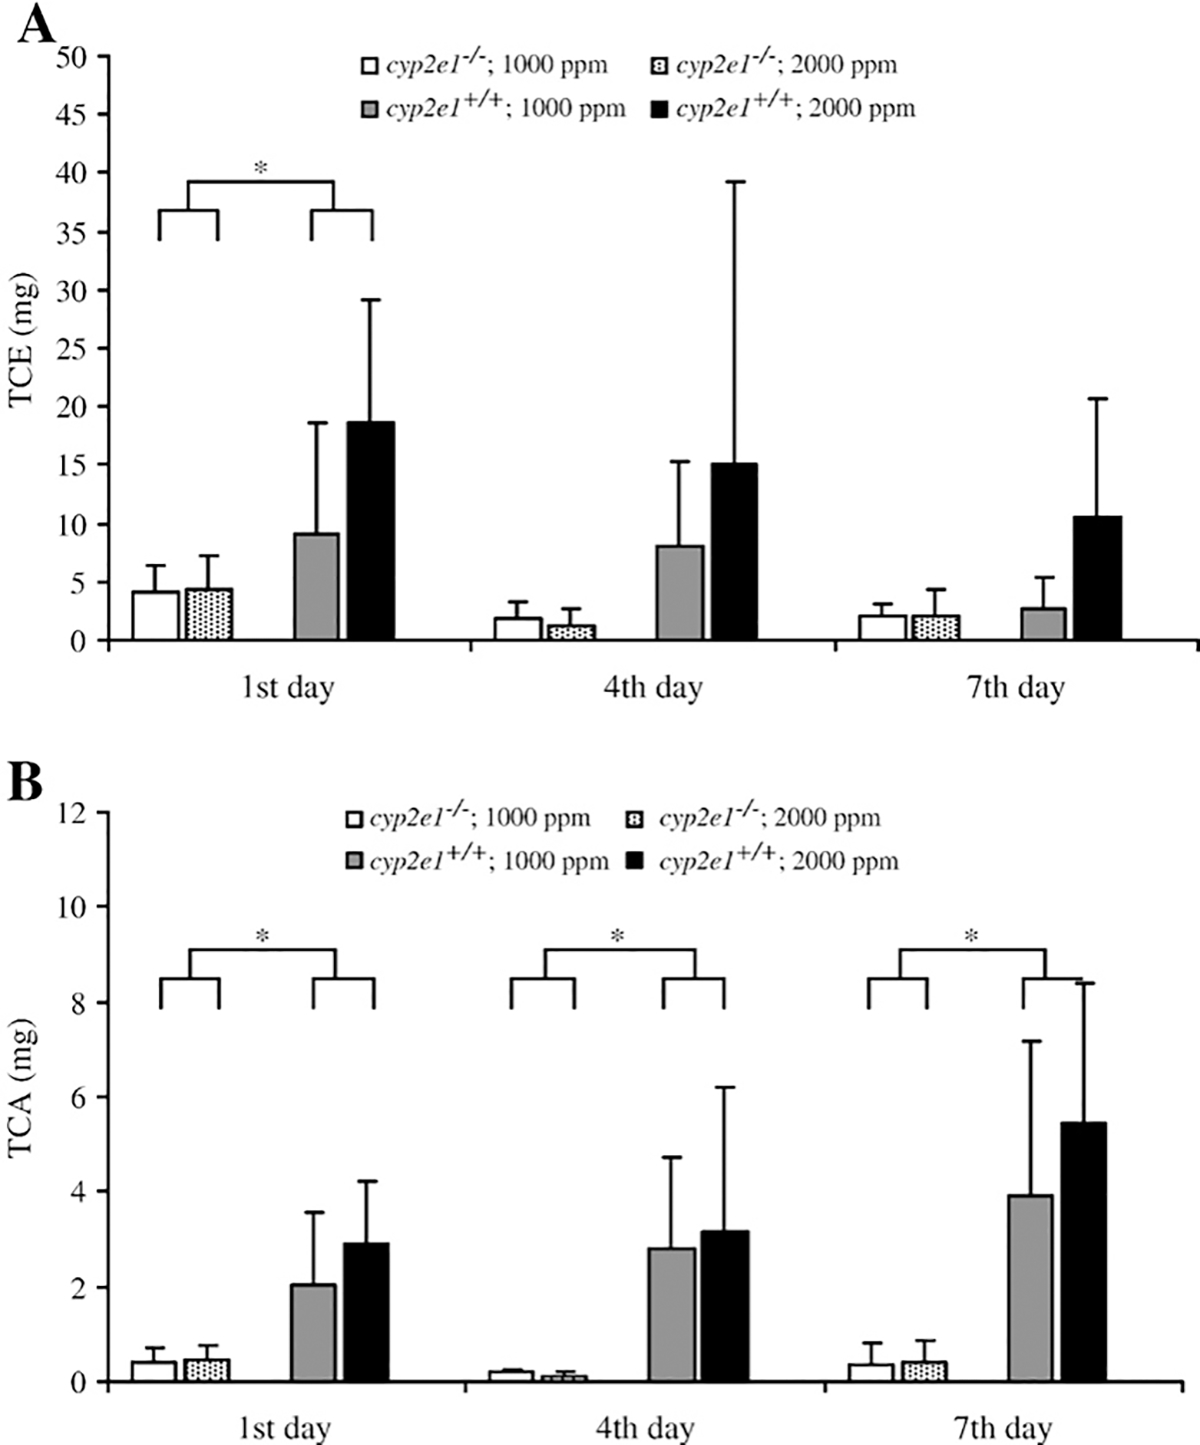
Amount of trichloroethanol (TCE) (A) and trichloroacetic acid (TCA) (B) on the 1st, 4th and 7th day of TRI exposure in cyp2e1+/+ and cyp2e1−/− mice. Values represent means ± SD for 5–6 mice per group. *Significant difference (p<0.05) between genotypes.