
Fig. 6.
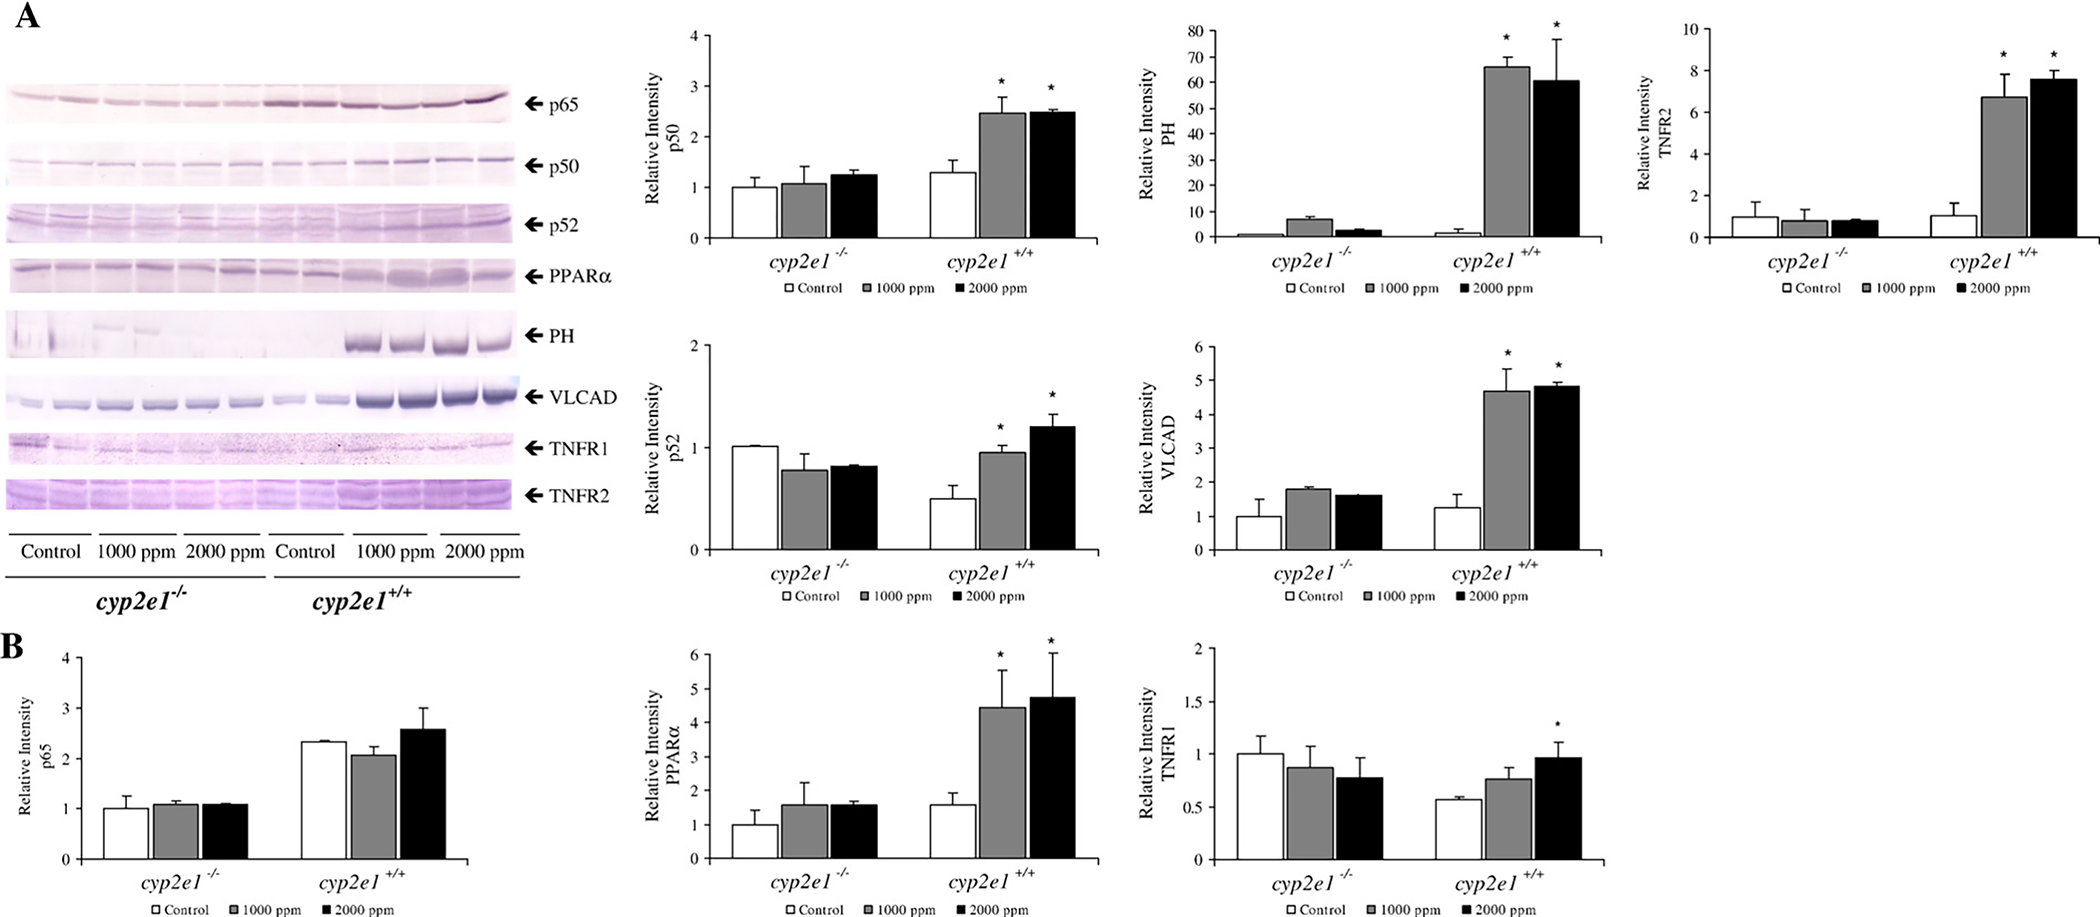
PPARα and NFκB protein expression in livers from cyp2e1+/+ and cyp2e1−/− mice after TRI exposure. (A) Western blot analyses of PPARα, PH, VLCAD, p65, p50, p52, TNFR1, and TNFR2 protein. Each band was quantified by densitometric analyses. (B). Histogram presents means ± SD for 4–5 mice per group, and mean from each control group was assigned value of 1.0. *Significantly different (p<0.05) from 0 ppm group (control).