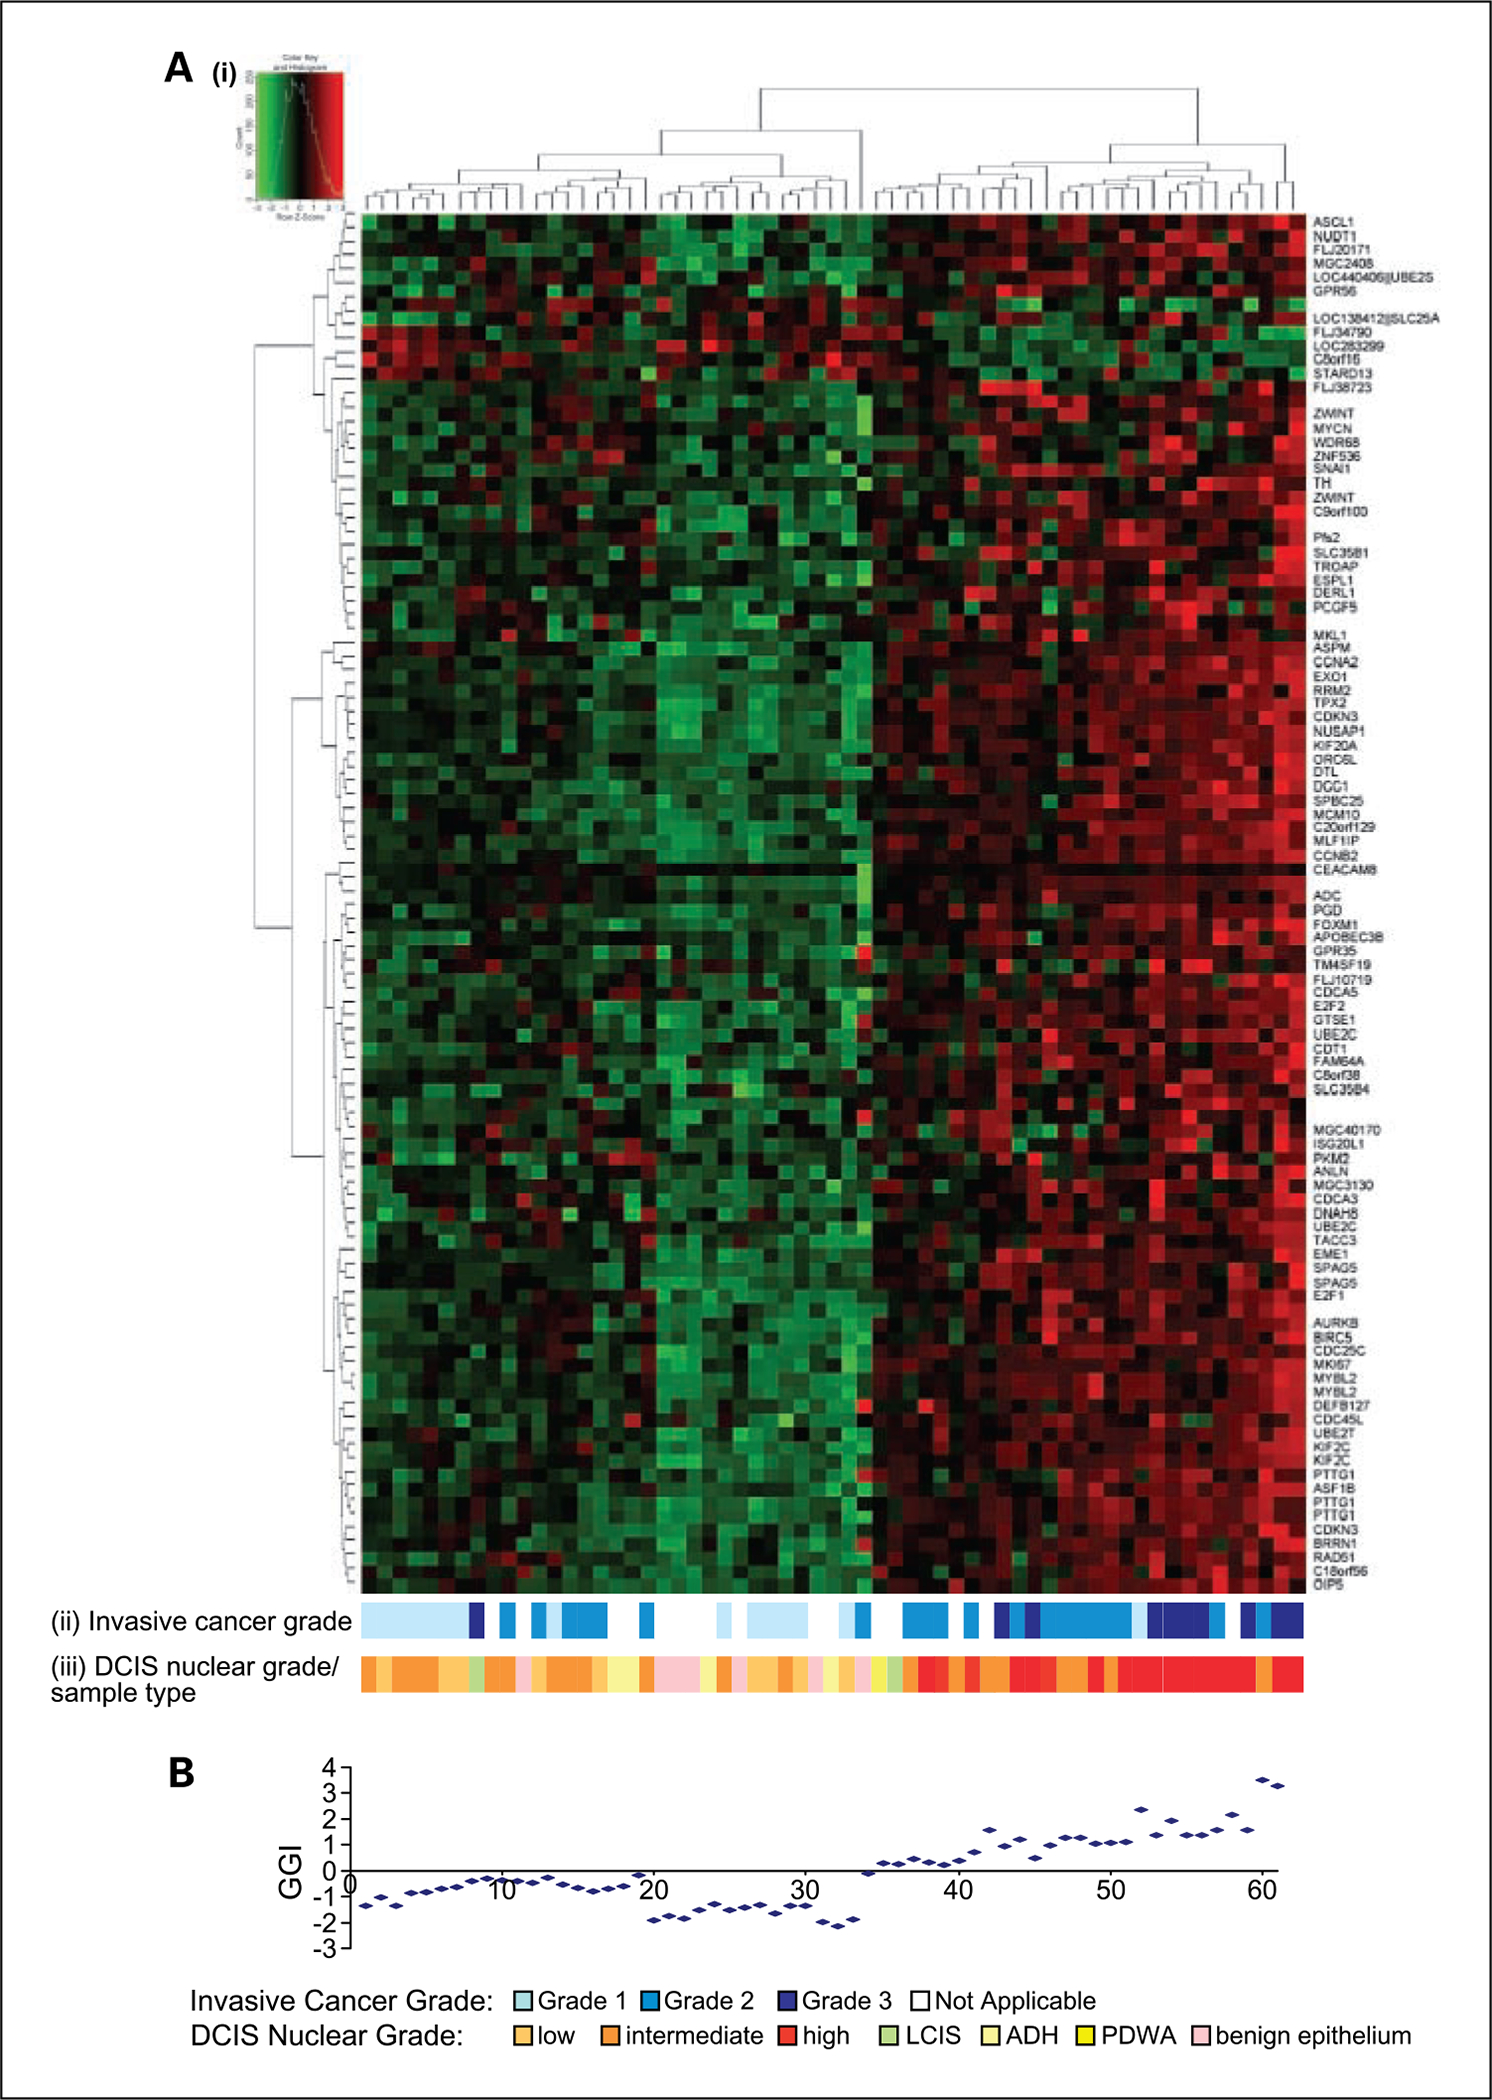
Fig. 1.

A, i, hierarchical clustering of 61 samples according to expression of the top 100 differentially expressed oligonucleotide probes (selected by supervised analysis of DCIS lesions associated with grade 1 and 3 invasive cancer). Columns represent samples; rows represent individual probes. Heatmap depicts high (red) and low (green) relative levels of gene expression. ii, grade of associated invasive breast cancer. iii, DCIS nuclear grade or sample type. B, GGI calculated for each sample in the corresponding heatmap column.
