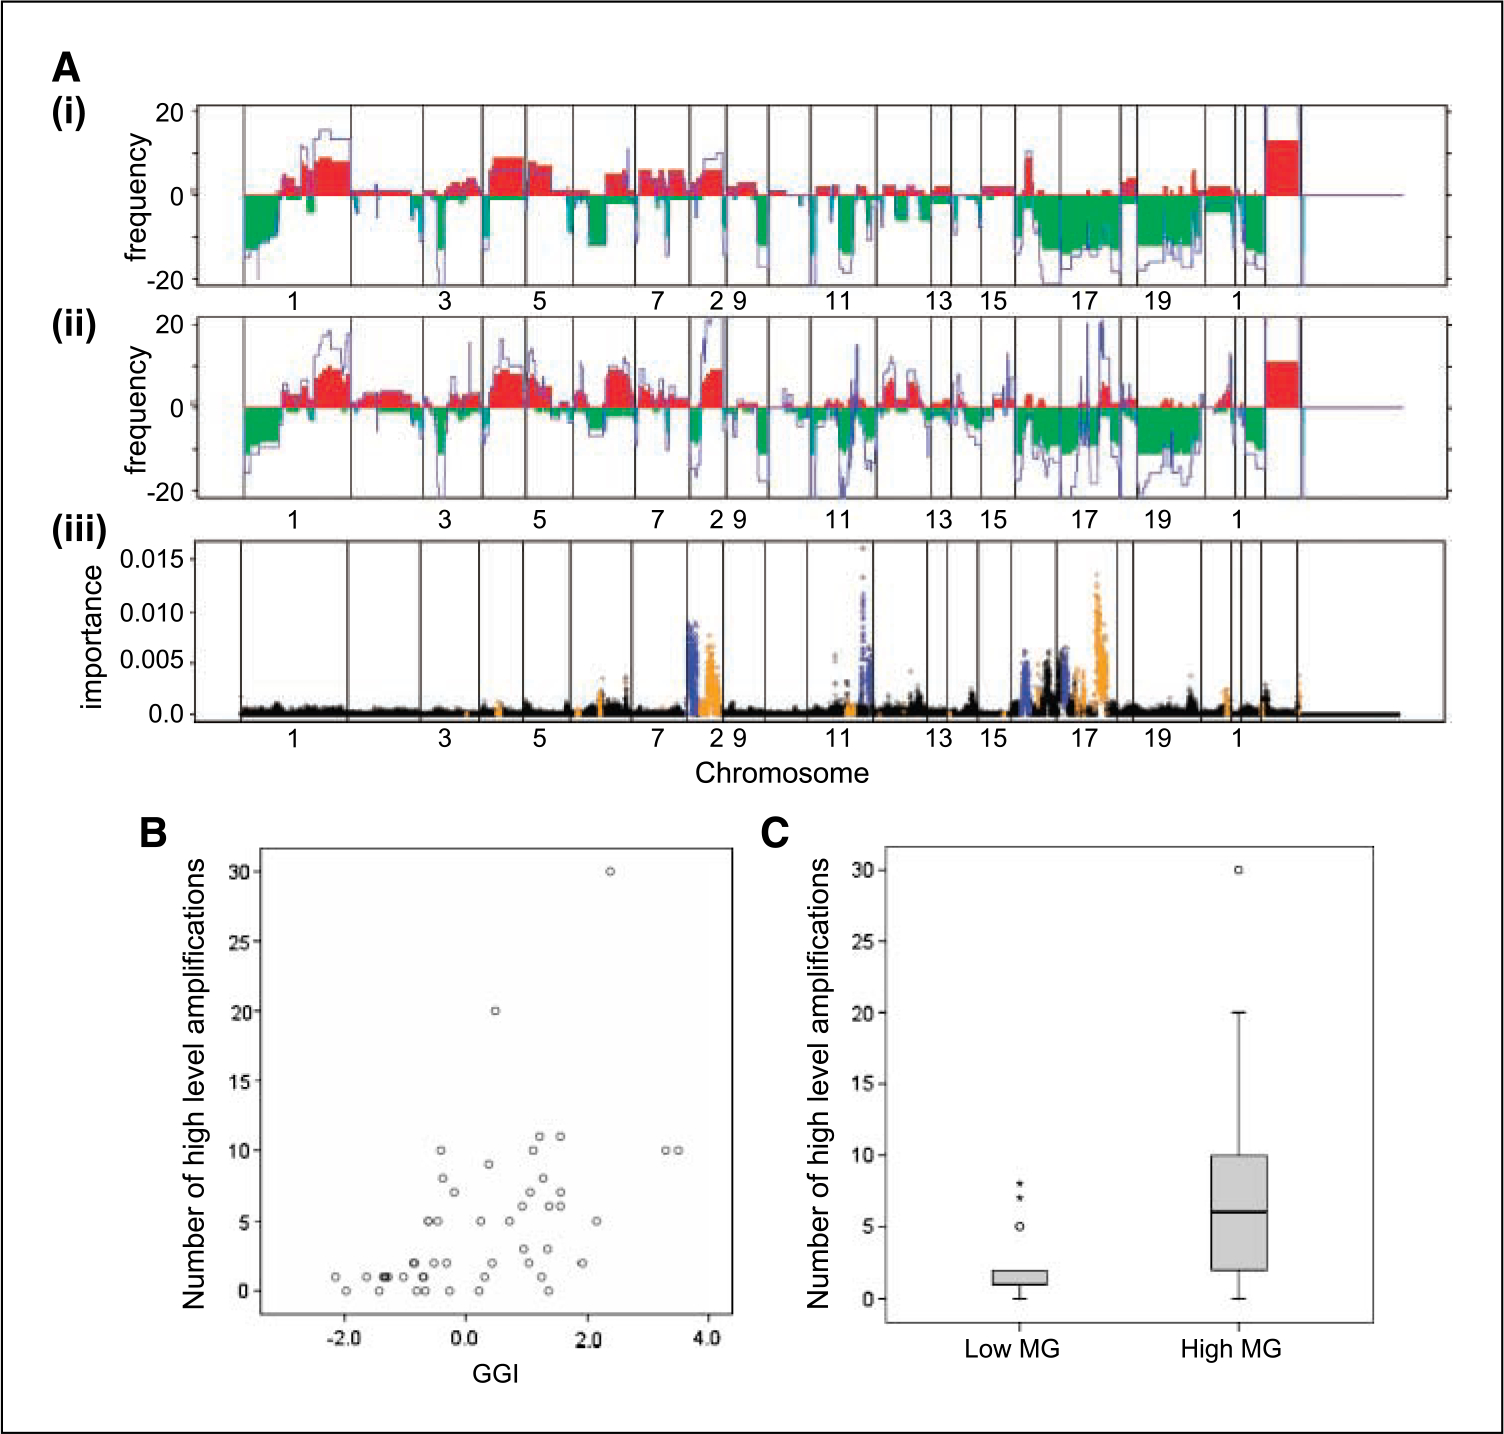
Fig. 3.

A, frequency of DNA copy number gains (red) and losses (green) across the genome (plotted from chromosome 1pter to 22qter, X and Y) in in situ carcinoma associated with grade 1 (i) and grade 3 (ii) invasive cancer. Average log 2 ratio copy number compared with normal male reference DNA is shown in blue. iii, representation of random forest algorithm applied to determine the importance measure for each probe in distinguishing lesions associated with grade 1 or grade 3 invasive cancer. Points colored in blue highlight regions that have a much higher copy number in grade 1 cases than in grade 3; points in orange have a higher copy number in grade 3 than grade 1. Higher copy number is defined as a difference of 0.25 mean log 2 ratio or larger. B, correlation between the number of regions of high-level DNA amplification and GGI (P < 0.0001, r = 0.62, n = 50). C, number of regions of high-level DNA amplification in low MG and high MG subgroups of DCIS (P = 0.003, n = 46).
