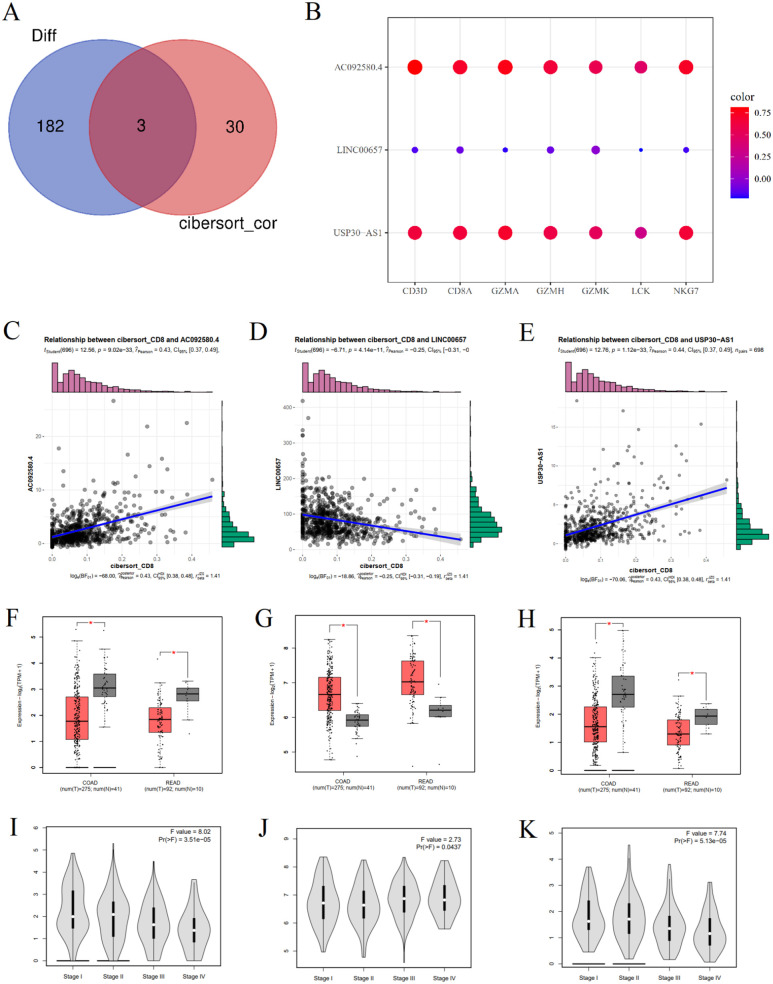
Figure 1.
The identification of CD8+ T cell infiltration–related lncRNAs. (A) The Venn plot showed the intersection of DElncRNAs and CD8+ T cell infiltration-related lncRNAs. (B) The dot plot showed the correlation coefficient of the expression of known CD8+ T cell marker and selected lncRNAs. (C-E) The correlation analysis of CD8+ T cell infiltration and the expression of selected lncRNAs, respectively. (F-H) The lncRNAs differential expression analysis in colon cancer and rectal cancer via gepia. Red was for tumor group, and gray was for normal group. *P < .05 was considered statistically significant. (I-K) The violin plot showed the expression of selected lncRNAs in different stages of CRC. Pr(>F) < 0.05 was considered statistically significant.

