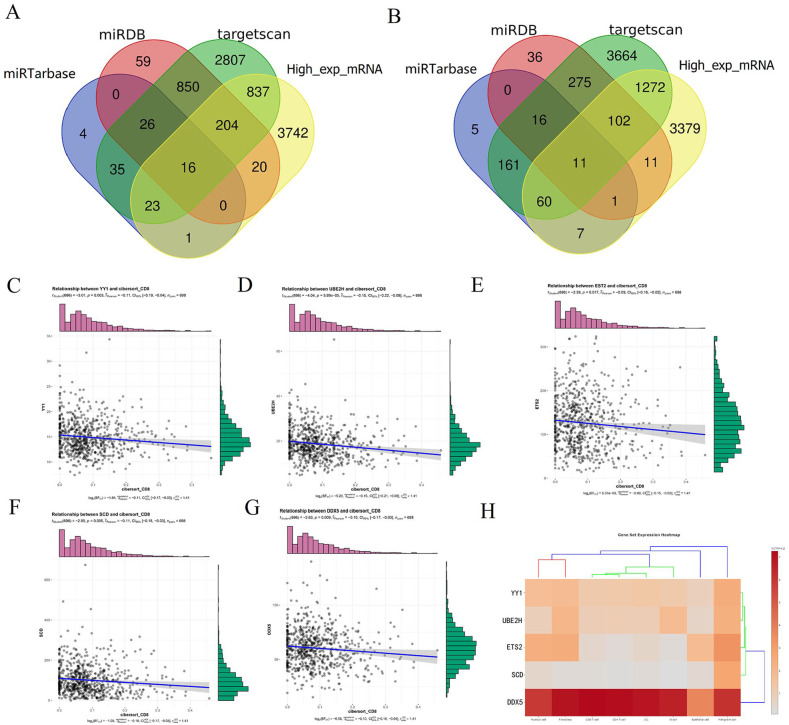
Figure 5.
The selection and evaluation of mRNAs. (A, B) The Venn plots showed the selection of microRNA downstream mRNA. The right plot is for hsa-miR-338-5p, and the left plot is for hsa-miR-1224-3p. (C-G) The correlation analysis of CD8+ T cell infiltration and the expression of mRNAs (YY1, UBE2H, ETS2, SCD, DDX5). (H) The heatmap displayed the expression of mRNAs on different types of cells. YY1, UBE2H, ETS2, and SCD were highly expressed in malignant cells (tumor cells).

