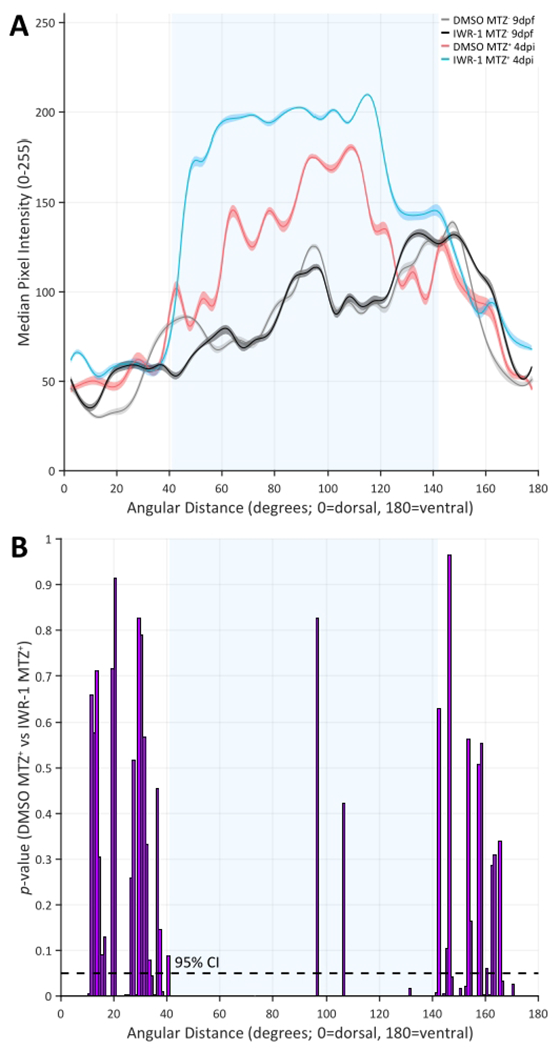
Figure 10: Group results and statistical comparison derived from automated quantification of RPE regeneration in RpEGEN.

(A) 5-degree binned median values and 95% confidence envelopes derived from the raw data for each group. The plot shows similarity between the MTZ− groups (black and gray lines) across the dorsal (0°) to ventral (180°) length of the RPE with notable differences between and among the MTZ+ groups (blue and red lines) in the central RPE (light blue shaded area between ~40-140°). Specifically, median pixel intensity appears lighter (0 = black and 255 = white) in the IWR-1 MTZ+ 4 dpi when compared to any other treatment group, which corresponds to decreased central RPE pigmentation. (B) A statistical comparison of the median values derived from 1-degree bins across the dorsal (0°) to ventral (180°) length of the RPE for DMSO MTZ+ 4 dpi and IWR-1 MTZ+ 4 dpi reinforces the observation in (A). p-Values were calculated using a permutation simulation with 20,000 repetitions and a two-sided test for each 1-degree bin. Under the null hypothesis that the two groups have similar median values for any corresponding 1-degree bin, a p-value ≤ 0.05 indicates a statistically significant difference between the group medians (dashed black line = 95% confidence interval (CI)). The presence of p-values ≤ 0.05 across the central RPE (light blue shaded area between ~40-140°) indicates significantly less pigmentation in ablated (MTZ+) IWR-1-treated larvae when compared to ablated (MTZ+) DMSO-treated sibling controls. Please click here to view a larger version of this figure.
