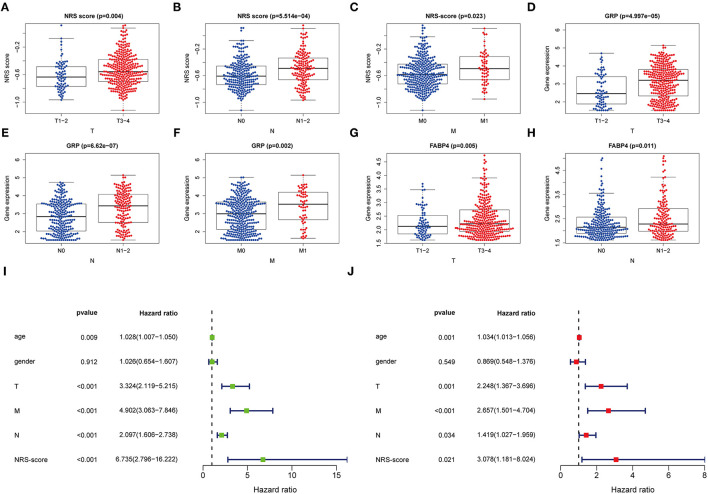
Figure 5.
Clinical application value and independent prognosis analysis. (A–C) Correlation between NRS-score and (A) T-stage, (B) N-stage, and (C) M-stage. (D–F) Correlation between GRP and (D) T-stage, (E) N-stage, and (F) M-stage. (G,H) Correlation between FABP4 and (G) T-stage, and (H) N-stage. (I) Univariate COX regression analysis based on NRS-score and clinical characteristics. (J) Multivariate COX regression analysis based on NRS-score and clinical characteristics.

