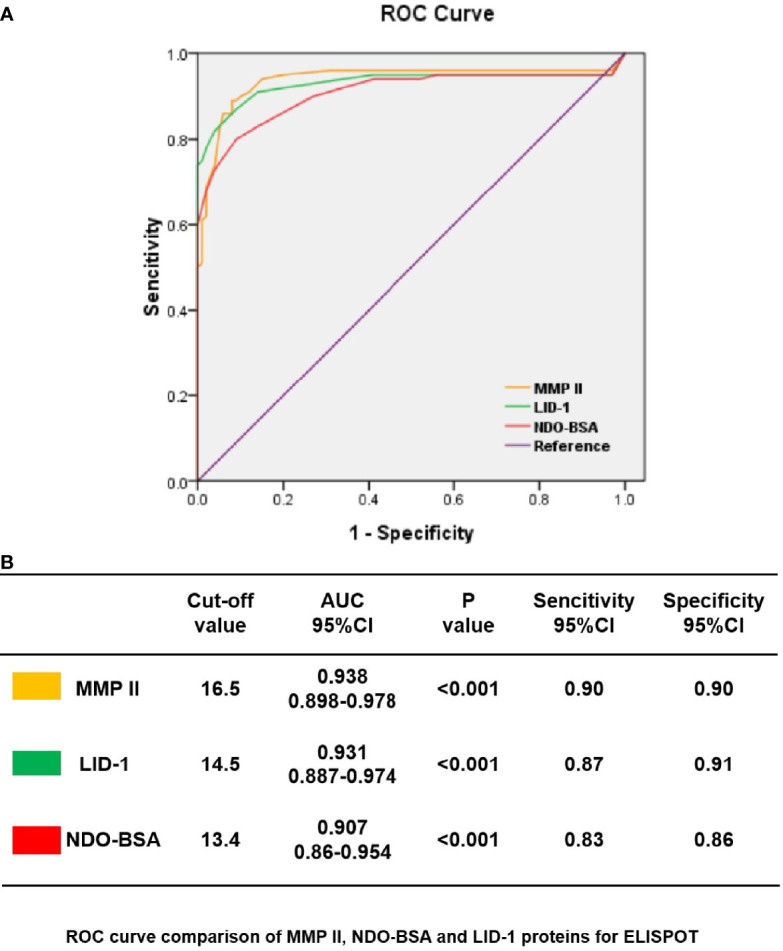
Figure 2.

ROC curves showing the accuracy of host marker IFN-γ in discriminating among PB, MB, HHC, and HD. ROC curves for the accuracy of single markers IFN-γ induced by MMP II, NDO-BSA, and LID-1 to differentiate among PB patients and other controls (A). ROC curves for markers that differentiated PB patients with health controls with p<0.001 are shown; the cutoff values with MMP II, NDO-BSA and LID-1 were 16.5, 13.4, and 14.5 respectively (B).
