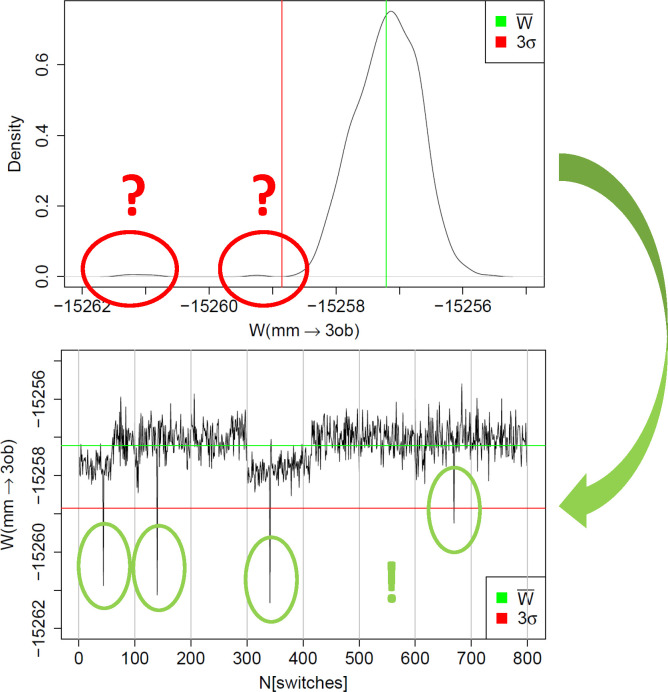
Figure 2.
(Top) Example of a non-Gaussian distribution of MM → SQM work values W. Additional modes of more negative work values are circled in red. The average work value W̅ is indicated by a green line and W̅ – 3σ by a red line. (Bottom) Same data displayed as a “quasi” time series; green and red lines indicate W̅ and W̅ – 3σ as before. Individual switches with working values deviating by more than 3σ are highlighted by green circles. All work values are in kcal/mol.

