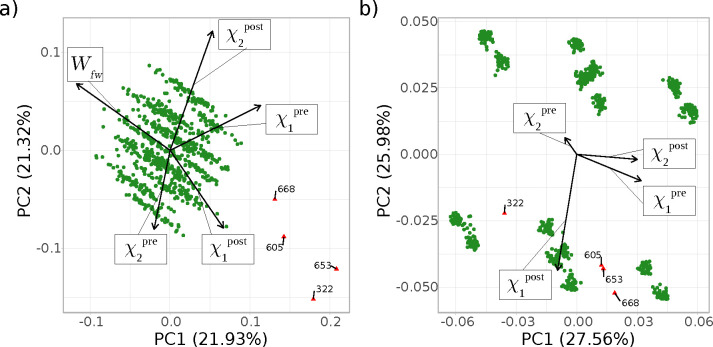
Figure 8.
PCA of compound 2 plotted as PC1 versus PC2 for the longer equilibration protocol as (a) scaled version and (b) unscaled version. Outliers are labeled explicitly and marked by red triangles (rather than green dots) according to the predefined outlier criteria (deviations less than W̅ – 3σ for panel a, and |χ̅2post| – 3σ for panel b, cf. “Quasi Time Series” Analysis).

