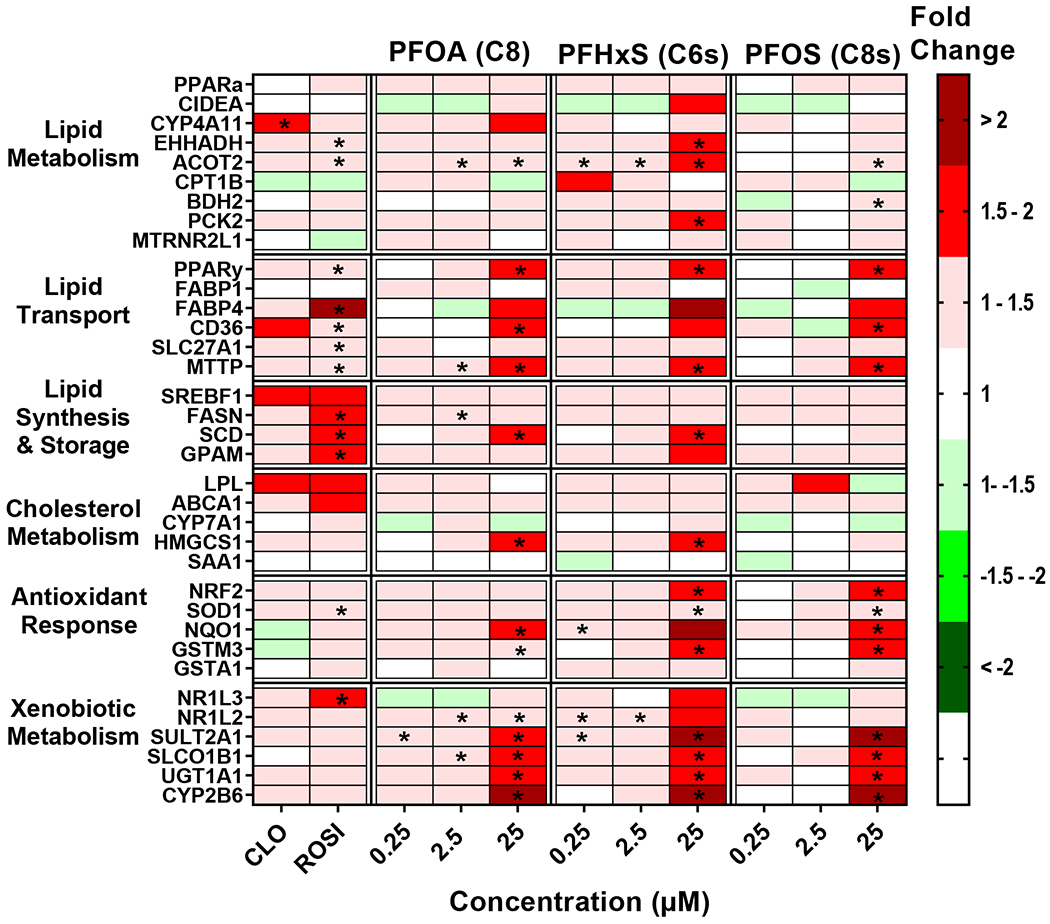
Fig. 1. Legacy PFAA exposure modulates gene expression changes in cryopreserved human hepatocytes.

Human hepatocytes were treated with PFOA, PFHxS, and PFOS at concentrations of 0.25-25 μM. Cell lysate was processed, and gene expression was analyzed using a custom QuantiGene bead plex assay and analyzed using BioPlex 200 System according to manufacturer’s protocols. Fluorescence intensity was normalized to β-actin and fold change was calculated compared to the vehicle control. Clofibrate (CLO, 250 μM) and rosiglitazone (ROSI, 5 μM) treatments were used as positive controls. Red indicates gene induction and green indicates gene repression. Fold change was calculated and analyzed using an ANOVA followed by Dunnett’s test compared to the DMSO treated cells. * indicates P < 0.05. All colors represent means; N = 3-4.
