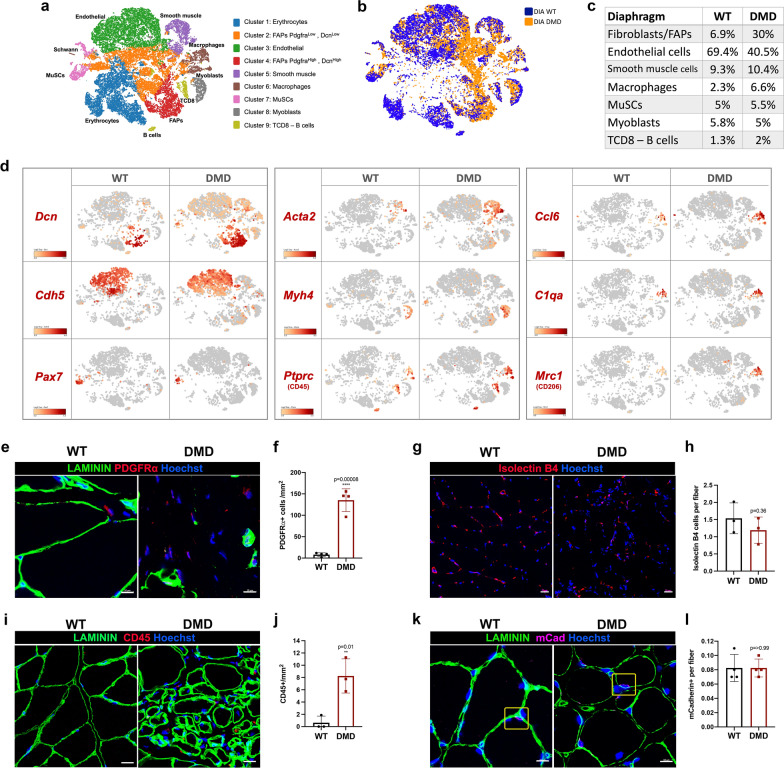
Fig. 6.
scRNAseq on 12-month-old R-DMDdel52 diaphragm compared to WT. a T-SNE clustering of rat muscle single-cell into nine populations. b Clustering overlay of WT and DMD muscle single-cells. c Proportion of major cell time of rat WT and DMD muscle cells. d Profiles of known markers in each cell population cluster (Dcn, Cdh5, Pax7, Acta2, Myh4, Ptprc, Ccl6, C1qa, Mrc1). e Representative immunofluorescence for PDGFRα (red) and LAMININ (green) in WT and DMD diaphragms at 12 months of age. Nuclei are counterstained with Hoechst (blue) (scale bar = 10 μm). f Quantification of the number of PDGFRα-positive cells per mm2 in WT and DMD diaphragms at 12 months of age. g Representative staining for ISOLECTIN B4 (red) and nuclei (blue) in diaphragms isolated from WT and DMD rats aged 12 months (scale bar = 20 μm). h Quantification of ISOLECTIN B4-positive vessels per fibre in TA of WT and DMD rats aged 12 months. i Representative immunofluorescence for CD45 (red) and LAMININ (green) in WT and DMD diaphragms at 12 months of age. Nuclei are counterstained with Hoechst (blue) (scale bar = 10 μm). j Quantifications of CD45-positive cells per mm2 in WT and DMD diaphragms at 12 months of age. k Representative immunofluorescence for mCADHERIN (purple) and LAMININ (green) in WT and DMD diaphragms at 12 months of age. Nuclei are counterstained with Hoechst (blue) (scale bar = 10 μm). l Quantifications of the number of mCADHERIN-positive satellite cells per fibre in diaphragms isolated from WT and DMD rats at 12 months

