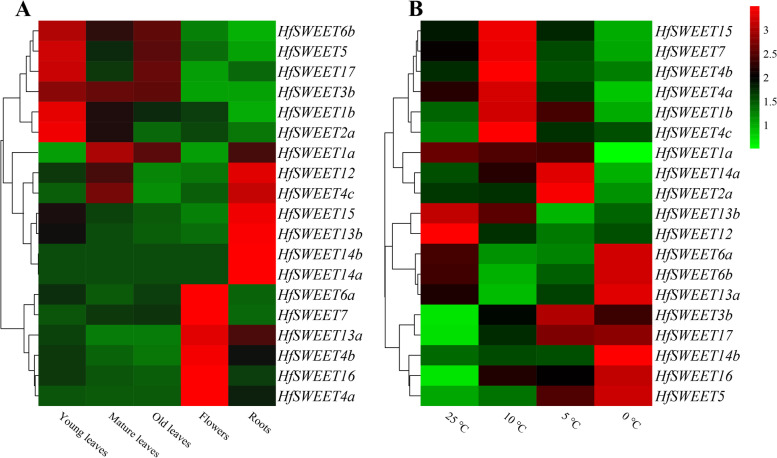
Fig. 6.
Expression patterns of HfSWEETs. A Expression patterns of HfSWEETs in different tissues, including young leaves, mature leaves, old leaves, flowers, and roots. B Expression patterns of HfSWEETs under different temperatures. Samples were collected from mature leaves. The control group (CK) was grown at 25 °C, while 10 °C, 5 °C and 0 °C were the low-temperature treatment groups. The colored bar represents the average of the relative expression levels. Statistical analysis was performed by SPSS 20 software, and a one-way analysis of variance (ANOVA) was performed for the relative expression of HfSWEETs in different tissues and response to low-temperature stress

