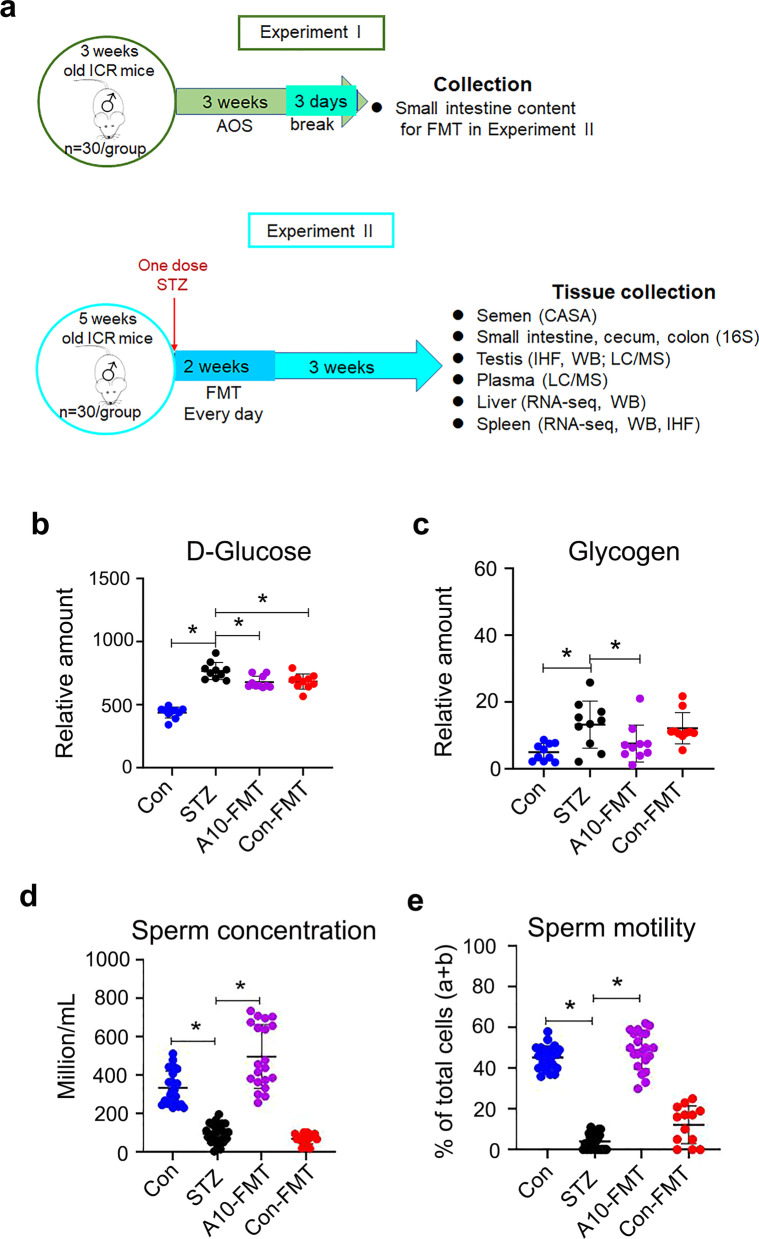
Fig. 1.
A10-FMT decreased blood glucose, and improved semen quality in type 1 diabetes. a Blood glucose levels. The y-axis represents the concentration. The x-axis represents the treatment (n = 30/group). *p < 0.05. b Blood glycogen levels. The y-axis represents the relative amount. The x-axis represents the treatment (n = 30/group). *p < 0.05. c Sperm concentration. The y-axis represents the concentration. The x-axis represents the treatment (n = 30/group). *p < 0.05. d Sperm motility. The y-axis represents the percentage of cells. The x-axis represents the treatment (n = 30/group). *p < 0.05

