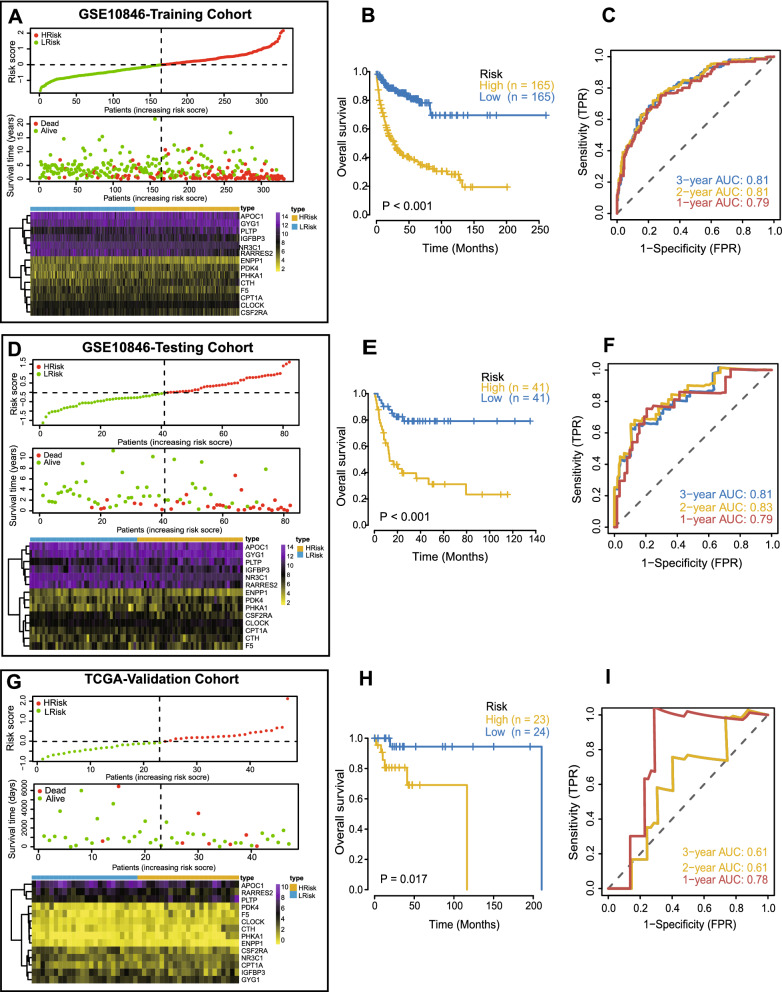
Fig. 2.
Construction of the risk model in the GSE10846 training cohort and validation of the risk model in the GSE10846 testing cohort and TCGA cohort. A, D, G Distribution of the risk score, survival status, and gene expression of 14 MAGs in the GSE10846 training cohort (A), GSE10846 testing cohort (D) and TCGA cohort (G). B, E, H Kaplan–Meier curves of OS of patients in the high- and lowrisk groups in the GSE10846 training cohort (B), GSE10846 testing cohort (E) and TCGA cohort (H). C, F, I ROC curves for predicting the 1/2/3-year overall survival in the GSE10846 training cohort (C), GSE10846 testing cohort (F) and TCGA cohort (I)

