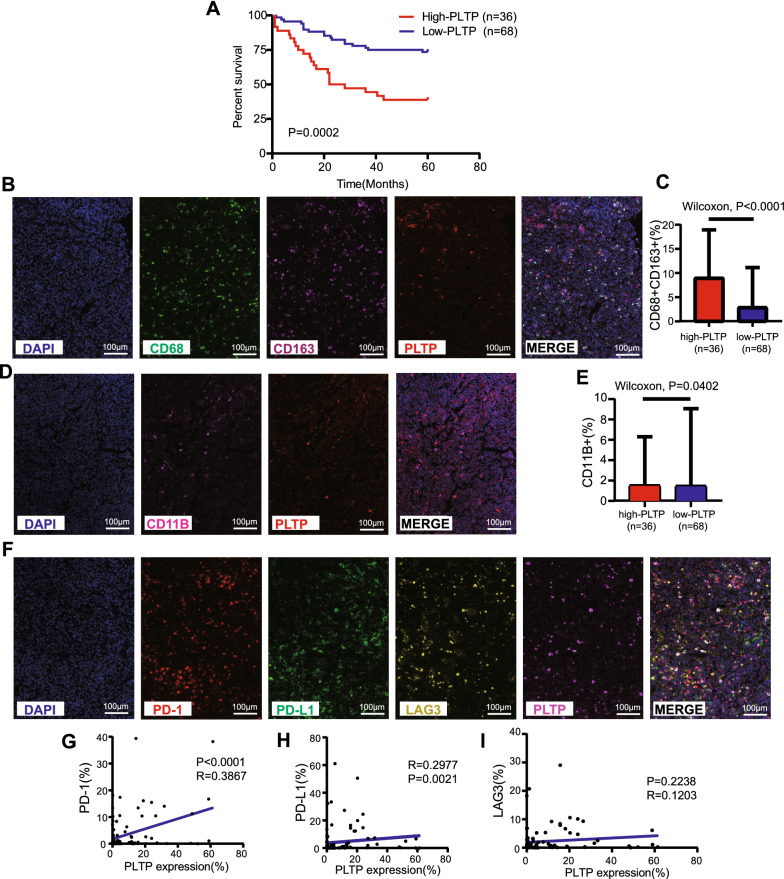
Fig. 6.
Experimental verification of the relationship between PLTP and prognosis and immune microenvironment in the DLBCL TMA cohort. A Kaplan–Meier curve for the PLTP high- and low- expression groups in our TMA cohort. The optimal cutoff point was obtained from X-tile 3.6.1 software. B Characterization of cell immunophenotypes with mIHC. A staining panel was developed to visualize DAPI, CD68, CD163 and PLTP simultaneously on the same tissue slide. C M2 macrophages content in the PLTP high- and low-expression groups. CD68+CD163+ indicated the content of M2 macrophages (p value by Wilcoxon rank-sum test). D Characterization of cell immunophenotypes with mIHC. A staining panel was developed to visualize DAPI, CD11B and PLTP simultaneously on the same tissue slide. E TAMs content in the PLTP high- and low- expression groups. CD11B+ indicated the content of TAMs (p value by Wilcoxon rank-sum test). F Characterization of cell immunophenotypes with mIHC. A staining panel was developed to visualize DAPI, PD-1, PD-L1, LAG3 and PLTP simultaneously on the same tissue slide. CD274 indicated the content of PD-L1 and PDCD1 indicated the content of PD-1. G–I Correlations between PLTP expression and immune checkpoints (including PD-1, PD-L1, and LAG3)

