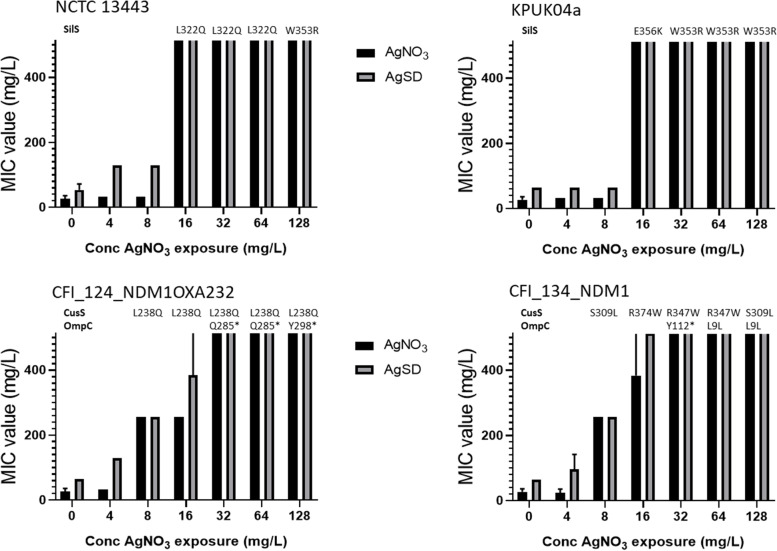
Fig. 2.
In strains which don’t contain the sil operon mutations in CusS are observed at sub-MIC AgNO3 exposure concentrations whereas mutations in OmpC were only found after exposure to supra-MIC silver concentrations. Strains which contain a sil operon (NCTC 13443 and KPUK04a) and strains which don’t (CFI_124_NDM1OXA232 and CFI_134_NDM1) were adapted to the presence of silver using a stepwise adaption method as already described where the AgNO3 concentration was doubled every two days starting at 4 mg/L and ending at 128 mg/L. At each exposure concentration the MIC values to AgNO3 (black bar) and AgSD (grey bar) were measured and compared to pre-exposure values (0 mg/L). Cultures from individual exposure concentrations were streaked onto TSA plates and individual colonies whole genome sequenced. Identified CusS, SilS and OmpC mutations are shown above the AgNO3 challenge concentration where they were observed. Values plotted are the mean of three repeats and the error bars represent the standard deviation (highest concentration tested 512 mg/L)

