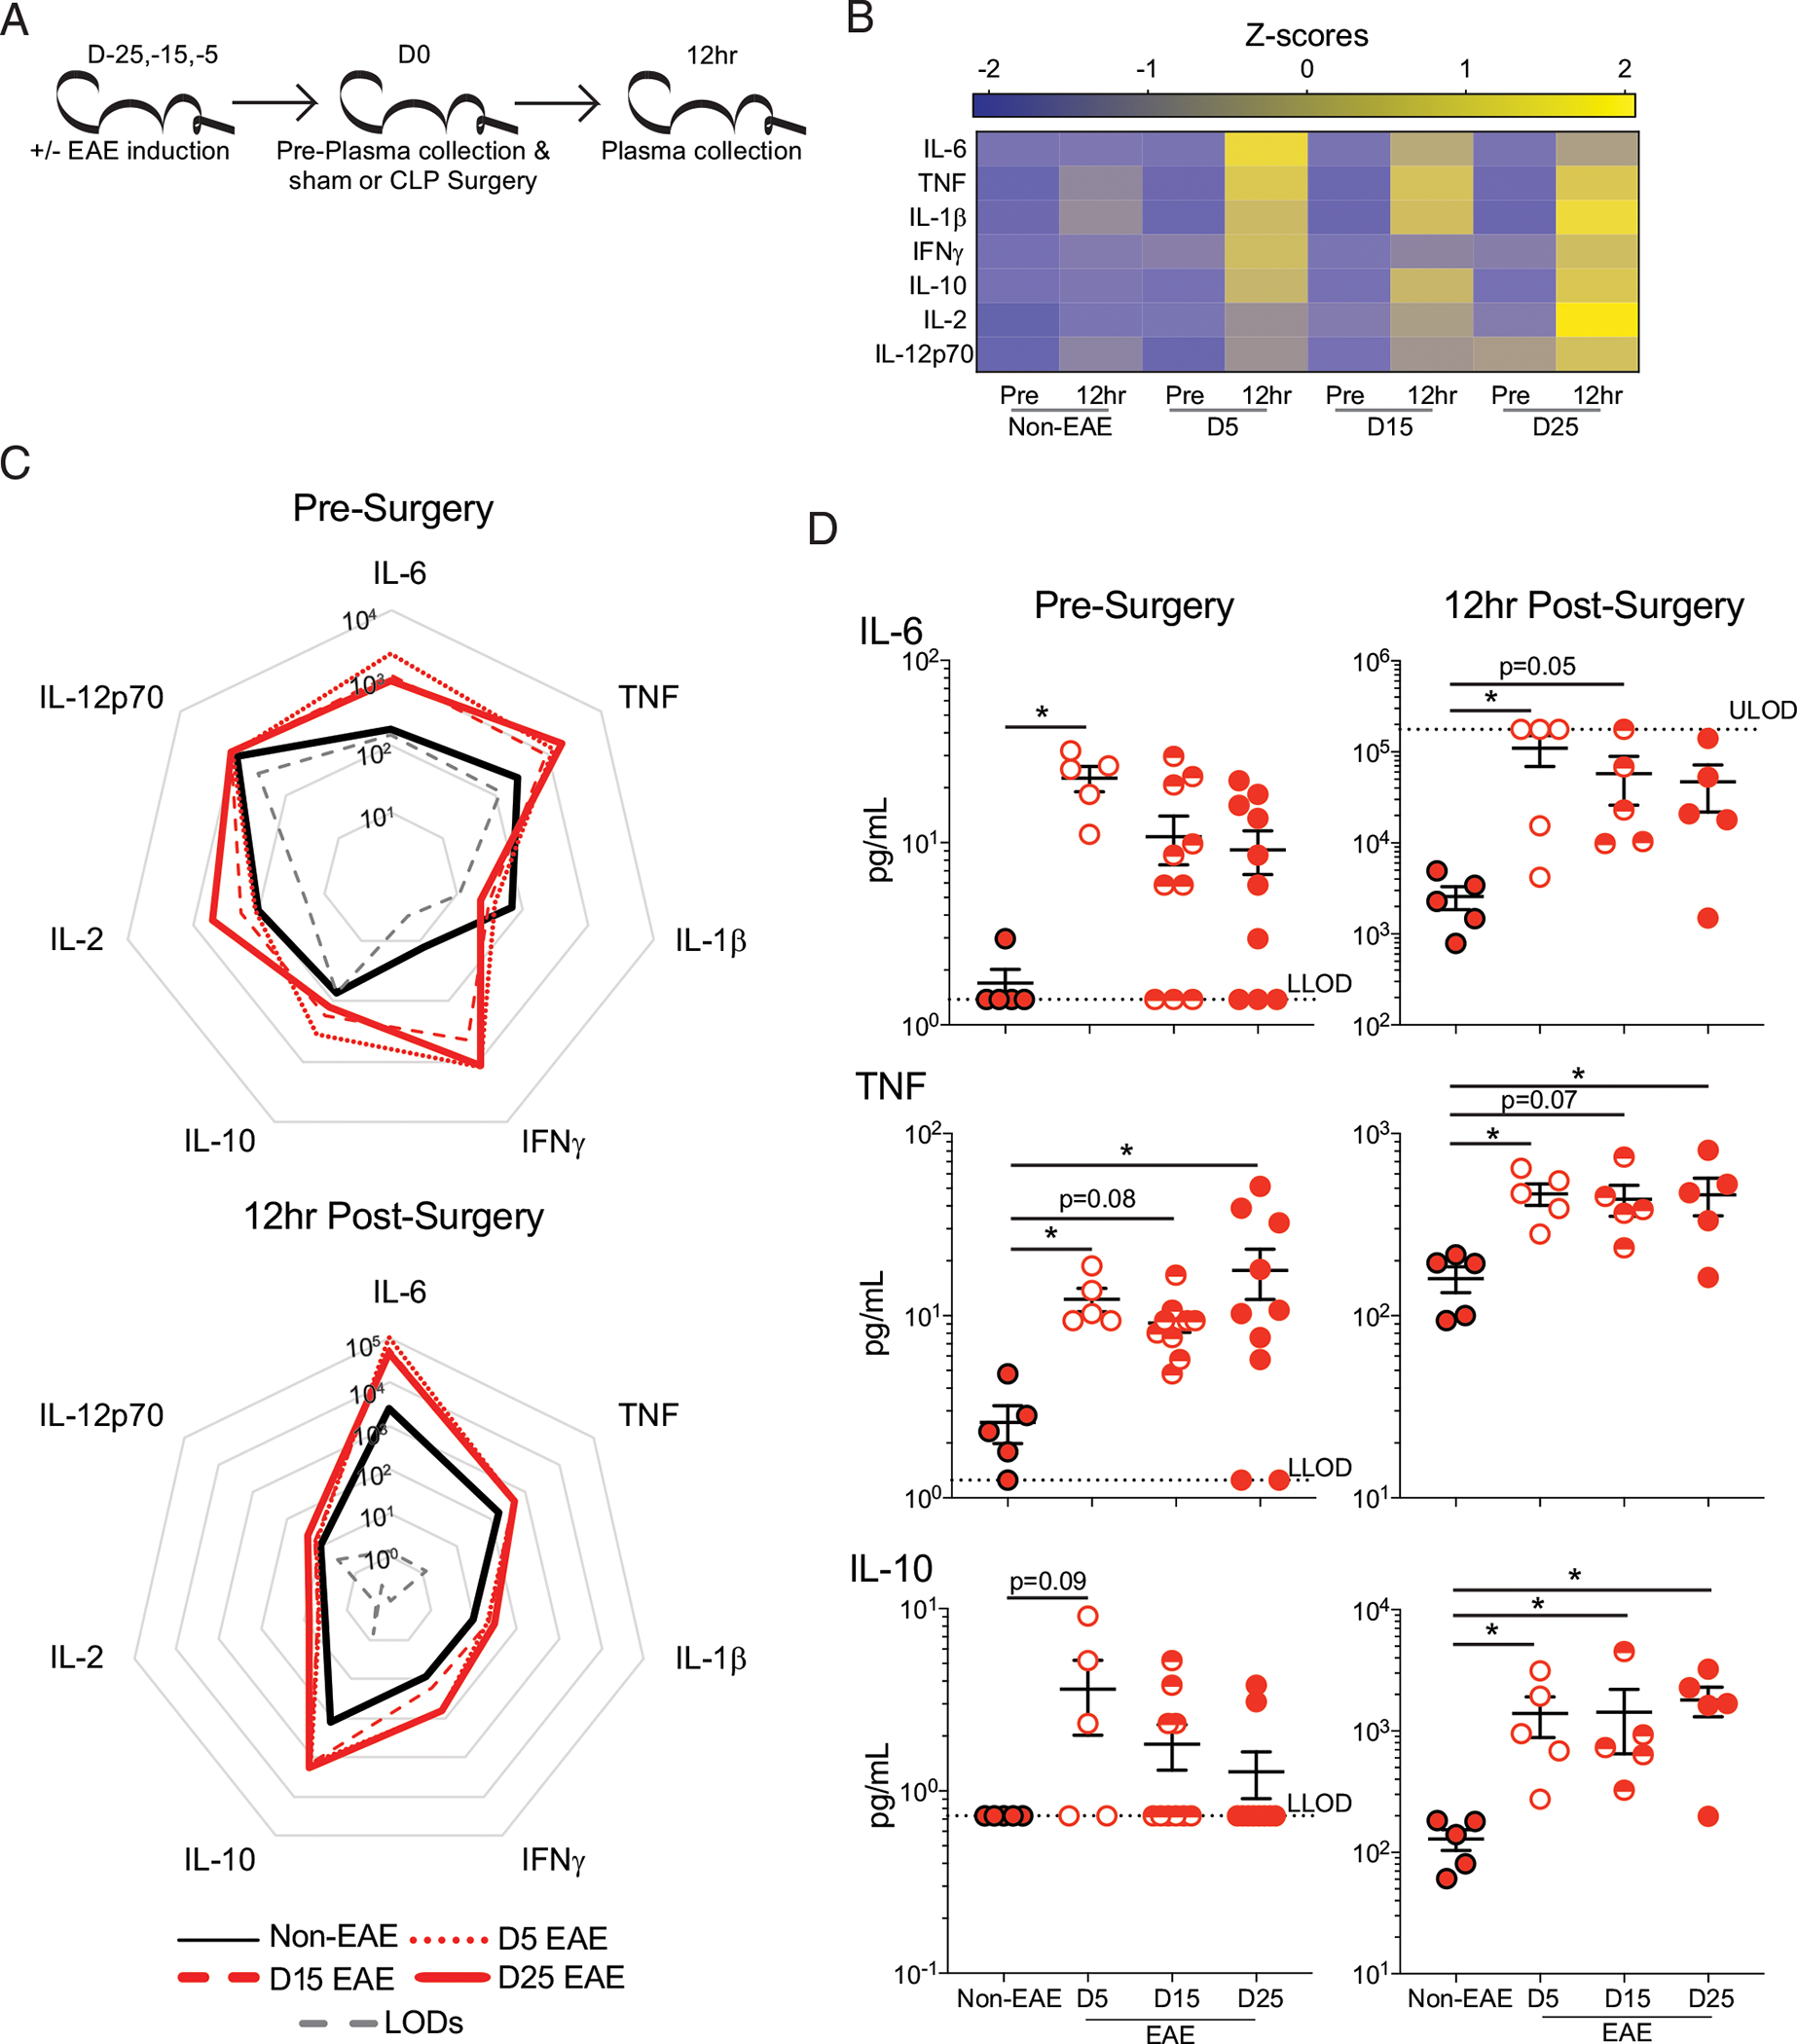
FIGURE 3. EAE mice have increased inflammation prior to and following sepsis induction.

(A) Experimental design: C57BL/6 mice were immunized with MOG35–55 to induce EAE at day −25, −15, or −5 prior to CLP surgery, and age-matched nonimmunized (non-EAE) underwent CLP surgery at the same time. Plasma was collected prior to surgery and 12 h postsurgery. (B) Heatmap of normalized plasma IL-6, TNF, IL-1β, IFN-γ, IL-10, IL-2, and IL-12p70 concentrations in non-EAE, D5EAE, D15 EAE, and D25 EAE mice prior to and 12 h post–CLP surgery. (C) Radar plots of plasma IL-6, TNF, IL-1β, IFN-γ, IL-10, IL-2, and IL-12p70 in non-EAE mice (black line), D5 (dotted red line), D15 (dashed red line), and D25 EAE mice (solid red line) prior to (top) and 12 h post– (bottom) CLP surgery. (D) Representative plasma cytokines (top to bottom: IL-6, TNF, and IL-10) prior to (left) and 12 h post– (right) CLP surgery in non-EAE (red circle with black outline), D5 EAE (white circle with red outline), D15 EAE (red semicircle), and D25 EAE (red circle with red outline) mice. Gray dashed lines indicate the upper limit of detection (ULOD) and lower limit of detection (LLOD) for the multiplex assay. Samples are combined from two independent experiments run on a single multiplex assay with 5–10 mice per group. Error bars represent SEM. *p < 0.05.
