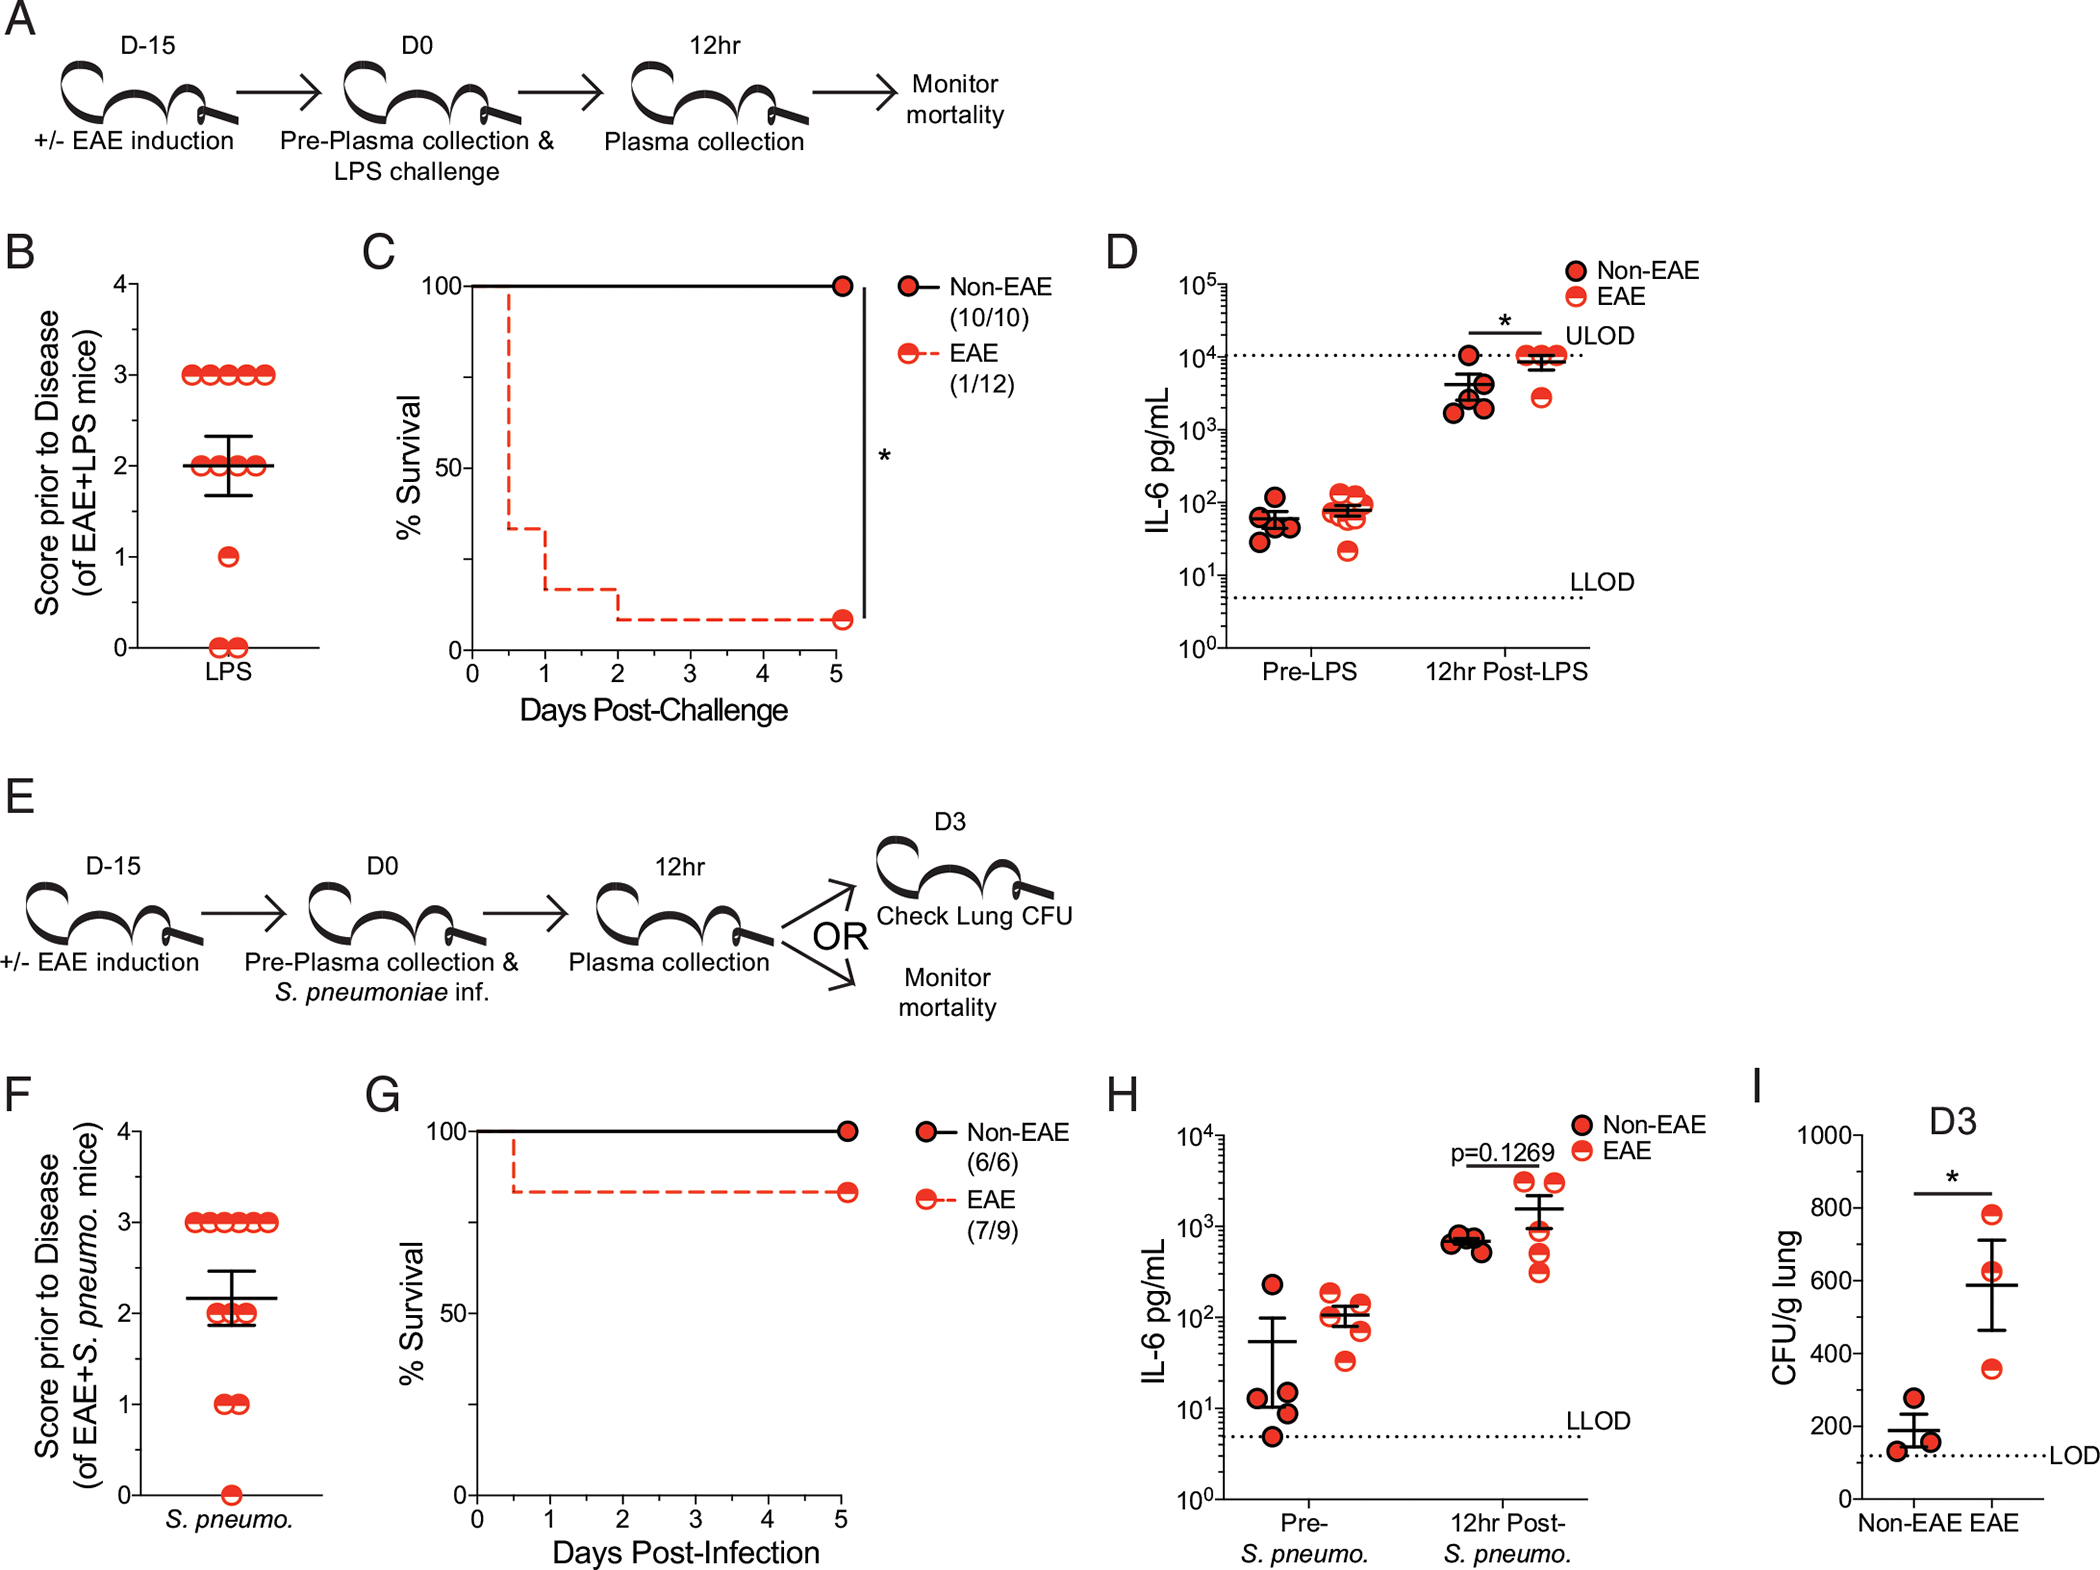
FIGURE 5. EAE mice have an increased susceptibility to multiple sepsis models.

(A) Experimental design: C57BL/6 mice were immunized with MOG35–55 to induce EAE 15 d prior to i.p. LPS injection, and age-matched nonimmunized (non-EAE) received identical injections. Plasma was collected prior to and 12 h post–LPS injection. Cohorts were monitored for survival. (B) EAE disease scores prior to LPS injection of EAE mice. (C) Kaplan–Meier survival curves for non-EAE and D15 EAE mice following LPS injection. (D) Plasma IL-6 prior to and 12 h post–LPS injection in non-EAE (red circle with black outline) and D15 EAE (red semicircle). Gray dashed lines indicate the upper limit of detection (ULOD) and lower limit of detection (LLOD) for IL-6 ELISA. Data are from a single experiment with 10–12 mice per group. Error bars represent SEM. *p < 0.05. (E) Experimental design: C57BL/6 mice were immunized with MOG35–55 to induce EAE 15 d prior to intranasal S. pneumoniae infection, and age-matched nonimmunized (non-EAE) received identical infections. Plasma was collected prior to and 12 hpost–LPS injection. Three mice from each cohort were used for determining lung CFU at 3 d postinfection. The remaining mice in each cohort were monitored for survival. (F) EAE disease scores prior to S. pneumoniae infection of EAE mice. (G) Kaplan–Meier survival curves for non-EAE and D15 EAE mice following S. pneumoniae infection. (H) Plasma IL-6 prior to and 12 h post–S. pneumoniae infection in non-EAE (red circle with black outline) and D15 EAE (red semicircle). Gray dashed line indicates the lower limits of detection (LLODs) for IL-6 ELISA. (I) S. pneumoniae CFU per gram of lung tissue 3 d after intranasal infection of non-EAE and D15 EAE mice. Dashed line indicates the limit of detection (LOD). Data are from a single experiment with 9–12 mice per group. Error bars represent SEM. *p < 0.05.
