. 2021 Jul 9;11(39):24254–24281. doi: 10.1039/d1ra03289e

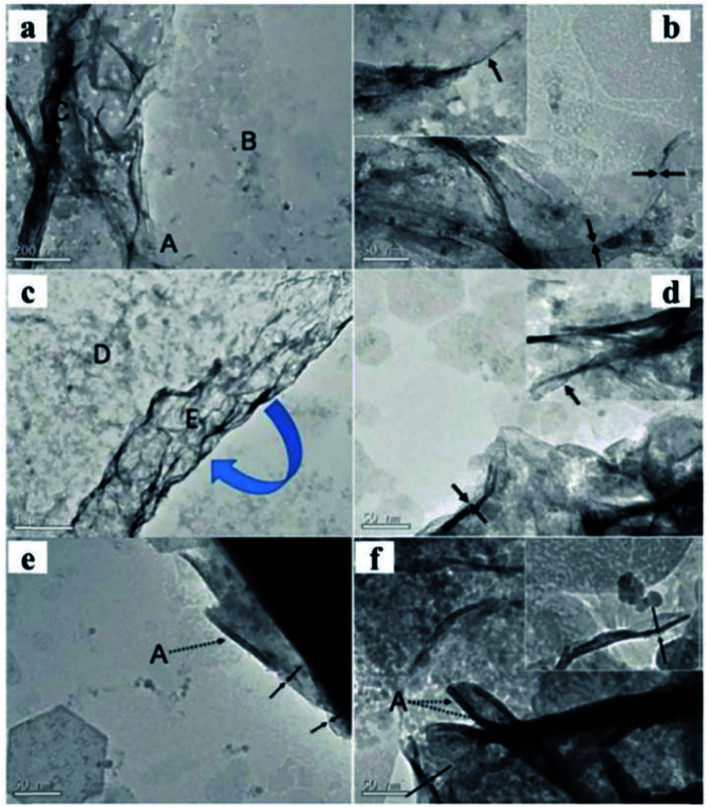
Fig. 15. TEM images of Mg1.97/Fe and Co0.96/Fe–LDH materials. Scale bars in the Mg1.97/Fe–LDH images, (a and b), represent 200 nm and 50 nm, respectively. Scale bars in the Co0.96/Fe–LDH images, (c and d), represent 1 mm and 50 nm, respectively. (e) Co1.07/Al and (f) Zn1.48/Al–LDH nanosheets. The dotted arrows marked by symbol “A” indicate the edges of the nanosheets seriously rolled because of the instability of the edges of the free-standing ultrathin LDH layers. Both scale bars represent 50 nm in (e and f). Insets in images (b, d, and f) display the corresponding side views. Reproduced with permission from ref. 68. Copyright 2010 American Institute of Physics.

Fig. 15