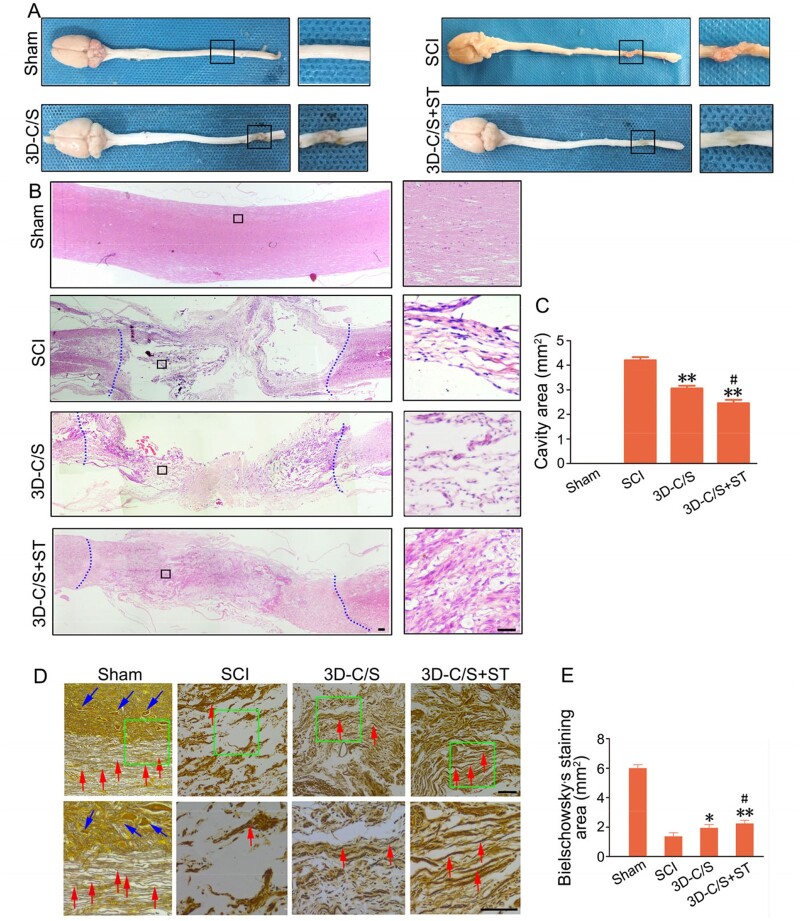
Figure 7.
Histology and quantification at 8 weeks after surgery. (A) Representative macrograph of spinal cord. The black box regions in the left image were enlarged in the right image. (B) Representative HE staining images. The black box regions in the left image were enlarged in the right image. (C) Quantification graphs of the average cavity area for HE staining image in rats with different treatments. (D) Bielschowsky’s silver staining of spinal cords horizontal sections. The green box regions in the image above were enlarged in the image below. (E) Quantification graphs of average Bielschowsky’s silver staining area. *P < 0.05, **P < 0.01 vs SCI. #P < 0.05 vs 3D-C/S+ST. Scale bars = 50 µm in panels (B and D).

