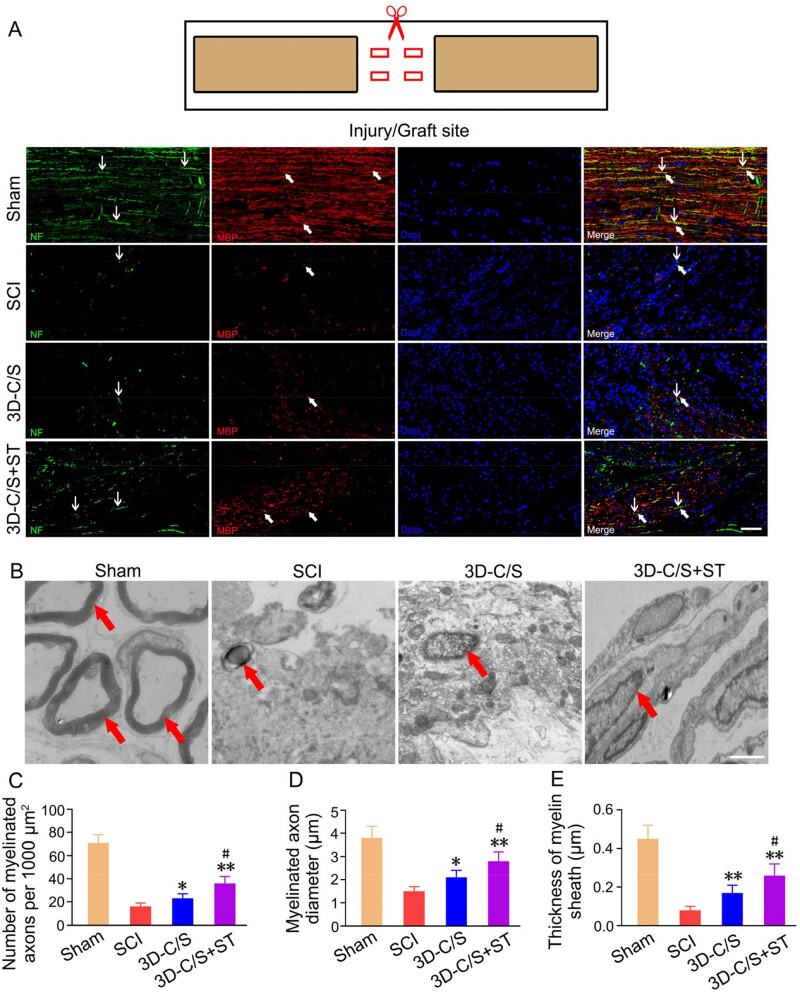
Figure 8.
Myelination and the TEM images of the injury site of spinal cord tissue in the Sham, SCI, 3D-C/S and 3D-C/S+ST groups. (A) Typical micrographs of NF (green, white arrow) and MBP (red, white arrow) expression. (B) Typical TEM images. Myelinated nerve fibers were indicated by red arrows. (C–E) Quantification of the number of myelinated axons (C), myelinated axons diameter (D) and thickness of myelin sheath (E). *P < 0.05, **P < 0.01 vs SCI. #P < 0.05 vs 3D-C/S. Scale bars = 50 µm in panel (A), 1 µm in panel (B).

