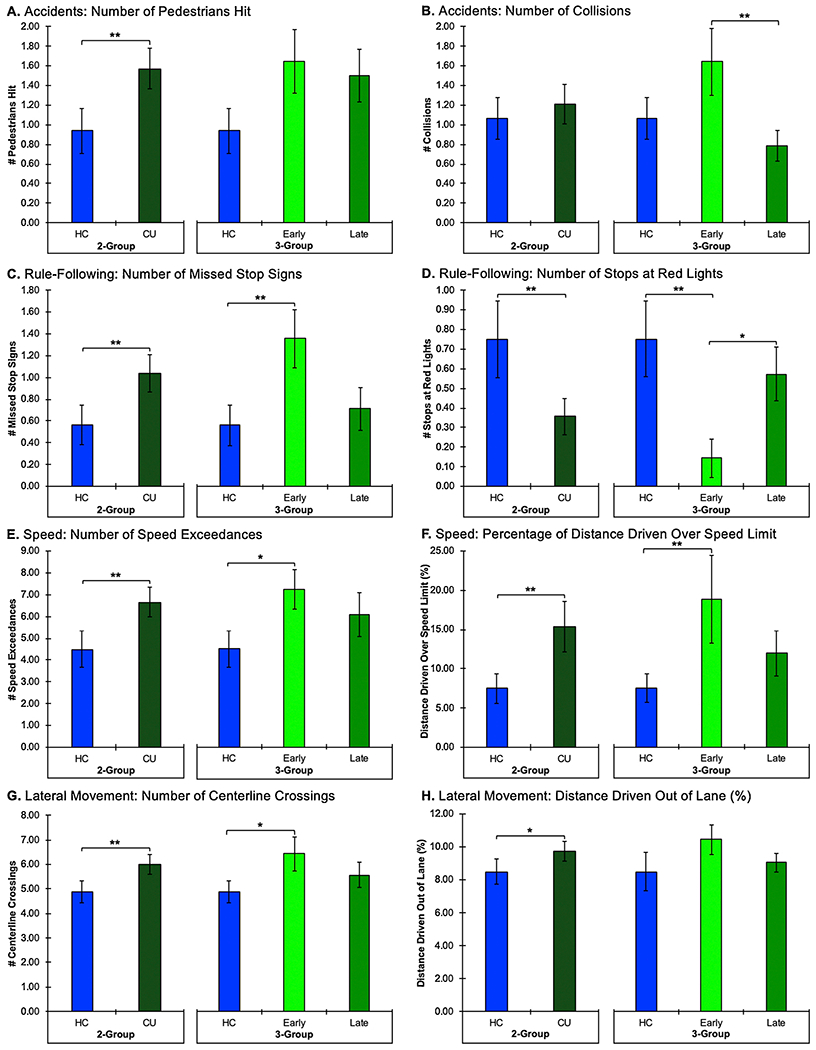
Fig. 1. Driving Simulator Performance Analyses.

The two-group assessments comparing the healthy control (HC) participants to all chronic, heavy cannabis users (CU) are on the left side of the graphs. The three-group assessments comparing HC versus early onset cannabis users (Early) versus late onset cannabis users (Late) are on the right side of the graphs. Note: ** denotes significance at p ≤ .05 and * denotes significance at p ≤ .10 (1-tailed).
