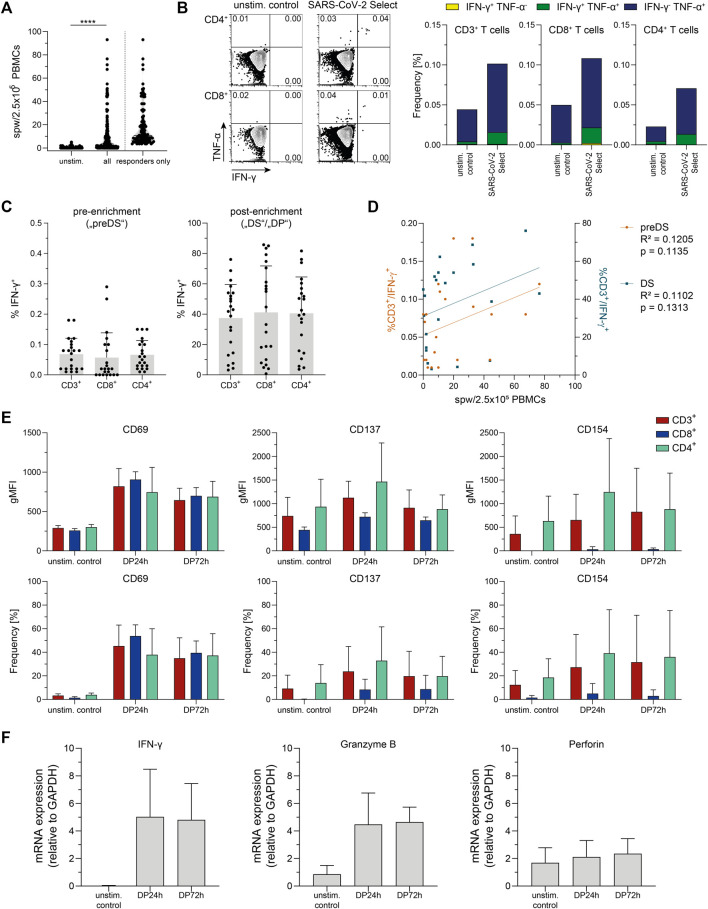
FIGURE 1.
Donor screening and pretesting. (A) Summarized results of donor screening via Interferon-gamma (IFN-γ) Enzyme-Linked ImmunoSpot (ELISpot) assay, n = 198 (all) and n = 104 (responders only) convalescent COVID-19 patients. unstim.: unstimulated control; spw: spots per well. Data are shown as violin plots, each symbol represents data obtained from one donor. ****p < 0.0001; Wilcoxon matched-pairs signed rank test. (B) Representative FACS plots and summarized results from intracellular cytokine staining in whole blood after stimulation with PepTivator SARS-CoV-2 Select using the SARS-CoV-2 T Cell Analysis Kit (Whole Blood) (Miltenyi Biotec). unstim. control: unstimulated control; TNF-α: Tumor Necrosis Factor-alpha. Data are shown as mean of data obtained from n = 12 convalescent COVID-19 patients. (C) Summarized frequencies of IFN-γ-secreting T cell subsets detected and magnetically enriched using Cytokine Secretion Assay (CSA); left: pre-enrichment (corresponding to pre drug substance („preDS“) in clinical manufacturing), values obtained from unstimulated control were subtracted; right: post-enrichment (corresponding to „DS“/drug product („DP”) in clinical manufacturing). Data are shown as mean + SD of data obtained from n = 22 convalescent COVID-19 patients. Each symbol represents data obtained from one donor. (D) Correlation of data obtained from ELISpot Assay (spw/2.5 × 105 PBMCs) and CSA (%CD3+/IFN-γ+) pre-enrichment (preDS) and post-enrichment (DS). Each dot corresponds to data obtained from one donor, n = 22 convalescent COVID-19 patients. Linear regression analysis was performed to calculate statistical significance. (E) Activation marker (CD69, CD137, and CD154) expression on indicated samples obtained via CSA, compared to unstimulated control (unstim. control). Data are shown as mean + SD of data obtained from n = 3 convalescent COVID-19 patients. (F) mRNA levels of IFN-γ, granzyme B, and perforin of indicated samples obtained via CSA. Data are shown as mean + SD of data obtained from n = 3 convalescent COVID-19 patients.

