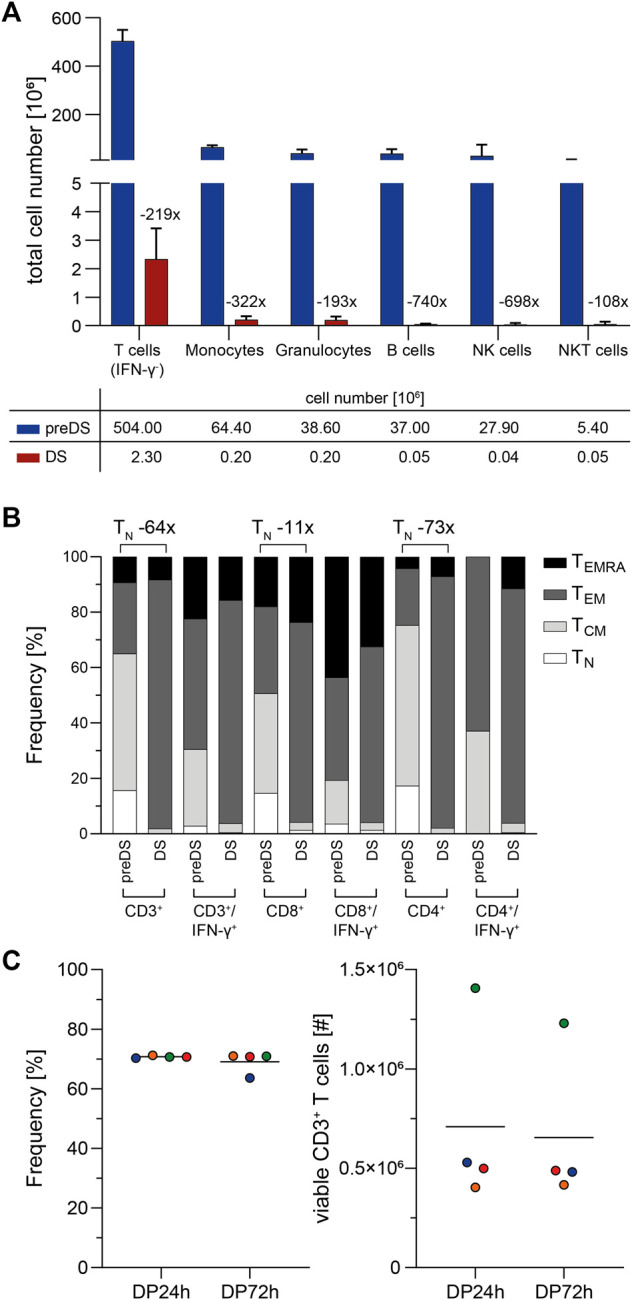
FIGURE 3.

Characterization of clinical-grade SARS-CoV-2-specific T cells (n = 4). SARS-CoV-2-specific T cells were magnetically enriched under GMP-compliant conditions using Cytokine Capture System (CCS) and CliniMACS Prodigy and analyzed via flow cytometry. (A) Impurities of SARS-CoV-2-specific T cell product. Shown is the fold-reduction of indicated immune cell subsets in the T cell product (drug substance, DS) compared to preDS (pre-enrichment). Bars and lines represent mean and SD, n = 4 manufacturing runs. IFN-γ: Interferon-gamma; NK cells: Natural Killer cells, NKT cells: Natural Killer T cells. (B) Memory phenotype composition of T cell product (DS) compared to preDS. Numbers above bars indicate fold change of naïve T cells (TN) between DS and preDS within indicated T cell subsets. TCM: T central memory; TEM: T effector memory; TEMRA: T effector memory re-expressing CD45RA. (C) Stability of SARS-CoV-2-specific T cell product during shelf-life in terms of viability (left; Frequency of 7-AAD- cells among CD45+ leukocytes) and total viable CD3+ T cell numbers (right) as determined via flow cytometry. 24 h/72 h: time after end of leukapheresis. Each symbol represents data obtained from one manufacturing run (same colors indicate matched data), horizontal lines represent the mean.
