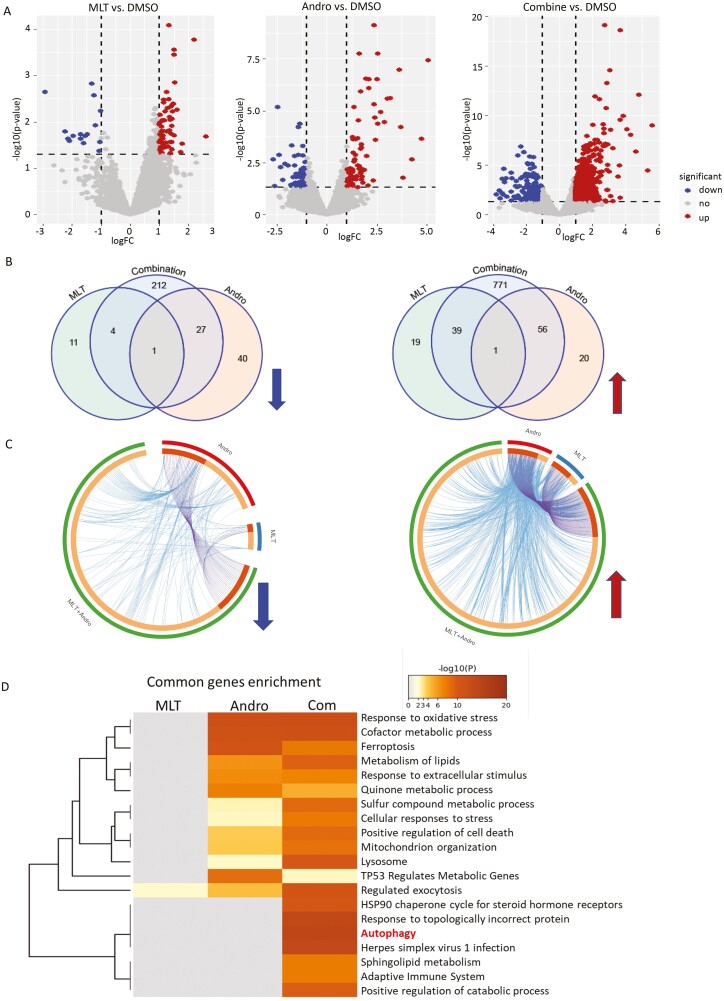
Figure 3.
Genomewide transcriptomic profiling changes in CRC cells following treatment with MLT, Andro and their combination. (A) The volcano plot obtained from genomewide transcriptomic analyses in HCT116 and SW480 cells in each treatment group (MLT, Andro and their combination) relative to vehicle-treated controls. (B) The Venn diagrams representing the overlap of DEGs among various treatment groups. The up- and down-regulated genes were analyzed and represented separately. (C) The circos diagram depicting the gene correlations among different treatment groups in the up- and down-regulated DEGs using Metascape software. The outermost ring depicts different treatment groups of MLT, Andro and their combination. The inner ring represents the genes that are common in multiple groups (darker orange) and that are unique to each group (lighter orange). (D) Comparative heatmap representing the convergence and difference among different treatment groups by biological functions and pathway enrichment using Metascape software.

