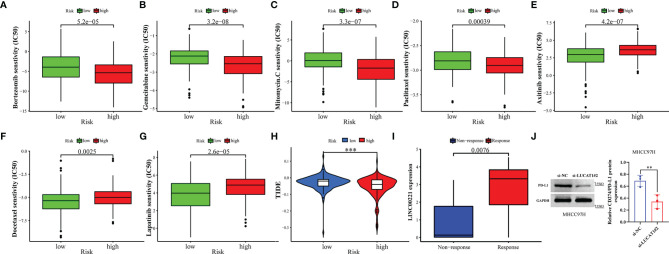
Figure 10.
GILncSig predicts chemotherapy and immunotherapy response. (A–G) The signature showed high-risk scores were associated with a lower IC50 for chemotherapeutics such as (A) bortezomib, (B) gemcitabine, (C) imatinib, and (D) paclitaxel, whereas they were related to a higher IC50 for (E) axitinib, (F) docetaxel, and (G) lapatinib. (H) Differences in TIDE score between high- and low-risk groups. (I) Different expression of LINC00221 predicts response to anti-PD-1 immune checkpoint inhibition therapy in HCC patients. (J) Effects of with or without inhibition of LUCAT1 expression on PD-L1 protein expression levels by western blotting. **p<0.01,***p<0.001.

