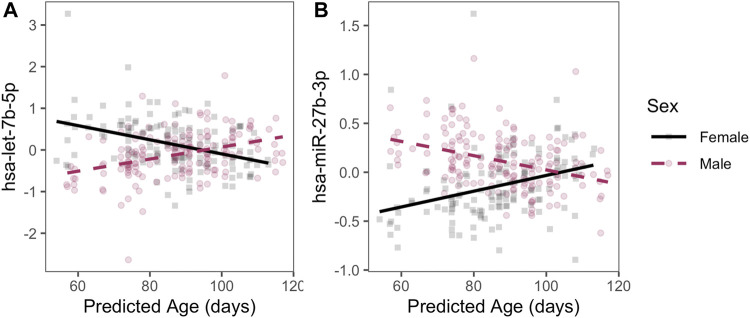
FIGURE 3.
Examples of sex-specific trajectories. Two miRNAs with statistically significant age-by-sex interactions are plotted with residualized expression (y-axis) across age (x-axis) during the pseudoglandular period differs by sex (indicated by color). Residuals are displayed to illustrate sex-by-age differences after adjusting for smoke exposure, technical batch, and the four RUV-inferred covariates to emphasize patterns by age and sex.

