Figure 5.
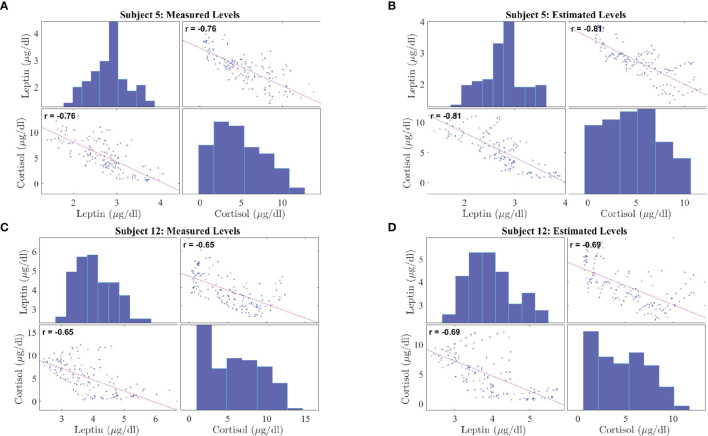
Correlation Plot between Leptin and Cortisol Levels in Patients with Obesity. The correlation plots are as follows: (A) measured leptin and cortisol levels for subject 5, (B) estimated leptin and cortisol levels for subject 5, (C) measured leptin and cortisol levels for subject 12, (D) estimated leptin and cortisol levels for subject 5. Each correlation plot incorporates a histogram and a scatter plot: the top left plot shows a histogram depicting leptin distributions and the bottom right plot shows a histogram depicting cortisol distributions, the bottom left plot and top right plot shows the scatter plot depicting correlation between leptin and cortisol.

