. 2021 Jul 21;11(41):25354–25363. doi: 10.1039/d1ra04718c

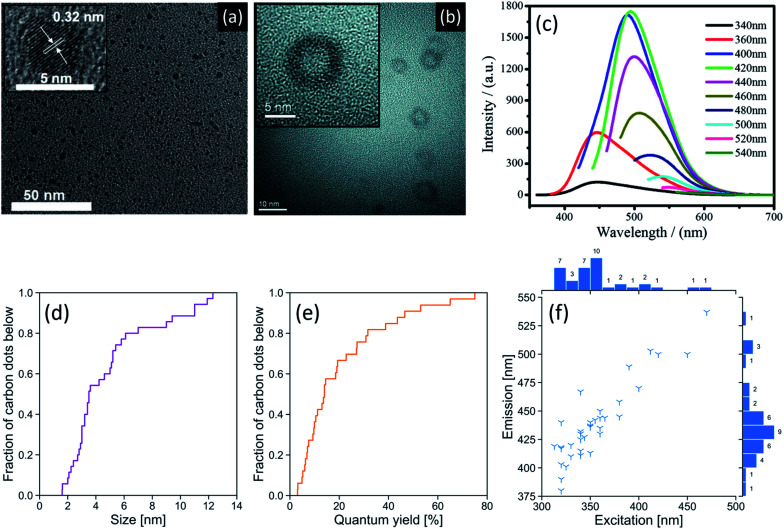
Fig. 2. (a) HR-TEM images of CDs synthesized from black pepper (inset: lattice spacing). Adapted from Open Access ref. 43. Copyright 2018 Vasimalai et al.; licensee Beilstein-Institut. (b) HR-TEM images of hollow CDs synthesized from bovine serum albumin. The hollow design allows for this CD to be used in drug delivery applications. Adapted with permission from ref. 46. Copyright 2013 Elsevier Ltd. (c) Fluorescence spectra of a CD synthesized from maize at different excitation wavelengths. These CDs displayed green colour at their peak fluorescence emission. Adapted with permission from ref. 19. Copyright 2017 Springer Science Business Media Dordrecht. Empirical cumulative distribution function plots of (d) CD size as measured by TEM and (e) fluorescence quantum yield. (f) Peak excitation and emission wavelengths of green-synthesized CDs. Counts are shown next to their respective bins and indicate the number of publications reporting CDs with properties in that bin's range. Peak emission and excitation generally move in the same direction. A reference list can be found in Table S2 of the ESI..

Fig. 2