Figure 3.
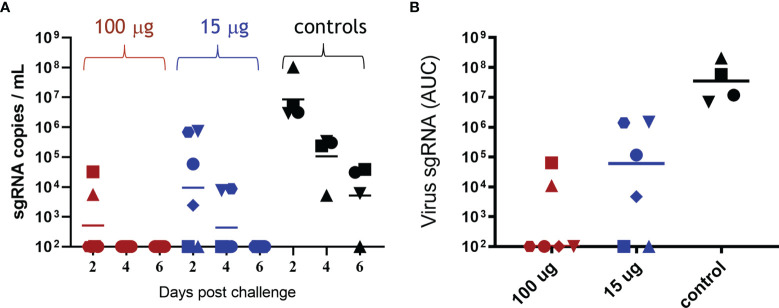
Viral load in bronchoalveolar lavage following SARS-CoV-2 challenge. Rhesus macaques were vaccinated and challenged as described in Figure 2 . sgRNA was measured in bronchoalveolar lavage on days 2, 4, and 6 post-challenge. (A) sgRNA copies per ml BAL are shown for each animal in the 100-μg ABNCoV2 group by red symbols, in the 15-μg ABNCoV2 group by blue symbols, and in the non-vaccinated control group by black symbols. The symbol shapes identify individual animals; the same symbols are used for the same animals throughout all post-challenge data. Horizontal bars depict geometric mean values. (B) Total amount of sgRNA in BAL per animal (symbols) and median values (horizontal bars) are calculated as area under the curve (AUC). Significant differences by Mann–Whitney test were seen between each vaccinated group compared with the control group (p = 0.0095).

