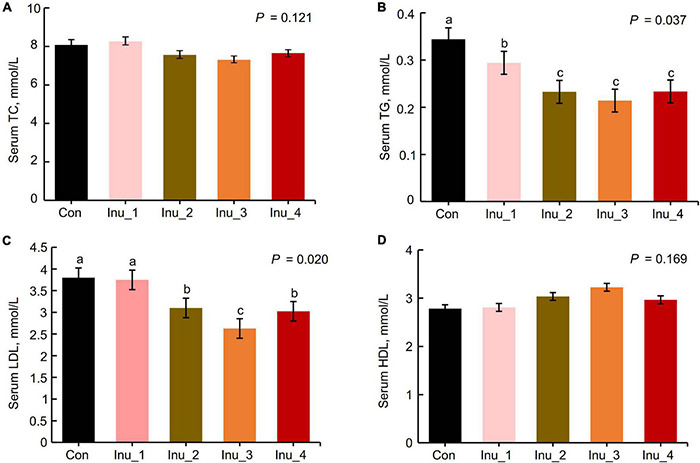
FIGURE 1.

Comparison of serum lipids and proinflammatory cytokines among control and inulin treatment groups (n = 8). TC, total cholesterol; TG, triglyceride; LDL, low-density lipoprotein; HDL, high-density lipoprotein. The data are means and standard error (SEM). Means with different letters (a, b, c) are significantly different (p < 0.05). The p-value indicates the significance of the difference between the five groups. Con, control group; Inu_1, inulin_1 group, the inulin addition level was 100 g/day per cow; Inu_2, inulin_2 group, the inulin addition level was 200 g/day per cow; Inu_3, inulin_3 group, the inulin addition level was 300 g/day per cow; Inu_4, inulin_4 group, the inulin addition level was 400 g/day per cow.
