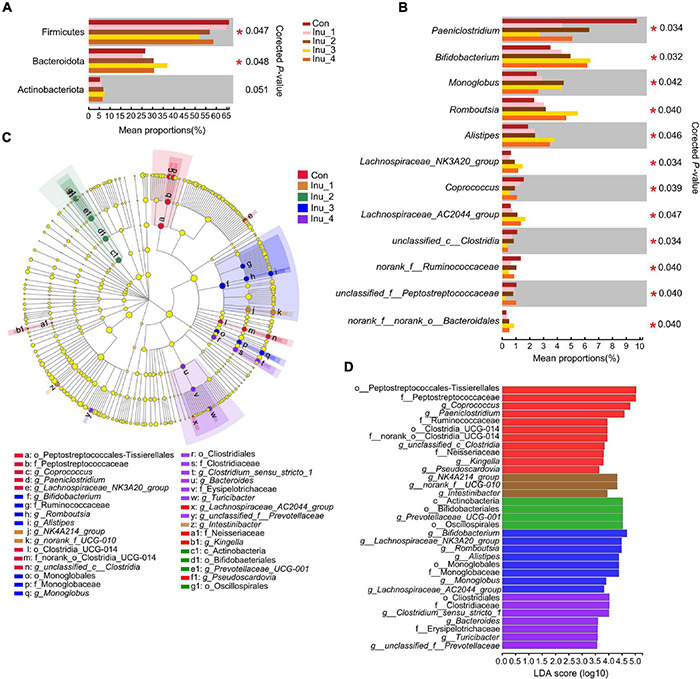
FIGURE 3.

Significant differential microbiota in the feces of subclinical mastitic cows among control and different inulin treatment groups. (A) at phylum level; (B) at genus level. (C,D) Linear discriminant effect size (LEfSe) analysis and bar chart of linear discriminant analysis (LDA) score of different bacterial taxa in the feces, respectively. LDA score > 3.5. Con, control group; Inu_1, inulin_1 group, the inulin addition level was 100 g/day per cow; Inu_2, inulin_2 group, the inulin addition level was 200 g/day per cow; Inu_3, inulin_3 group, the inulin addition level was 300 g/day per cow; Inu_4, inulin_4 group, the inulin addition level was 400 g/day per cow. *0.01 < corrected p-value < 0.05.
