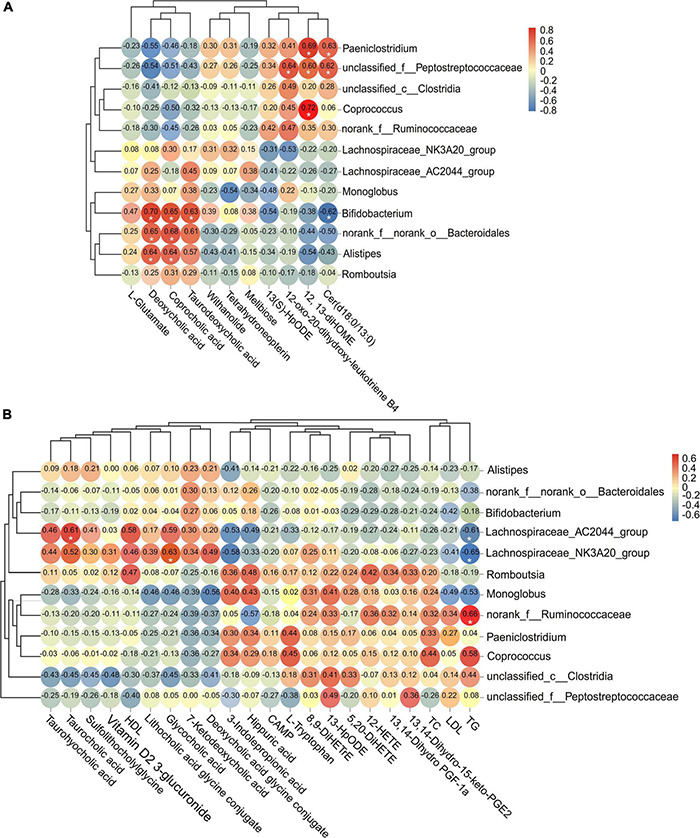
FIGURE 7.

Analysis of the correlation between significant different fecal microflora and metabolites in (A) feces and (B) serum. The threshold value of correlation coefficient is −1.0 to 1.0. Red represents positive correlation, and blue represents negative correlation. *Corrected p < 0.05.
