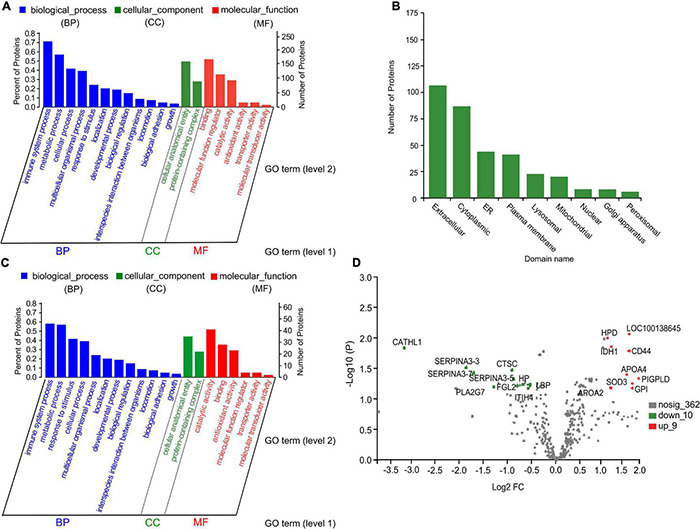
FIGURE 8.

Gene ontology (GO) functional annotation, subcellular location class, and volcano plot of serum proteins. (A,C) GO bar chart of total proteins and differential proteins with p < 0.05, respectively. Each column represents a multilevel classification of GO. The abscissa represents the multilevel classification term of GO. The left and right ordinate represent the percentage of the proteins contained in the classification to total number of proteins, and the number of proteins in the classification, respectively. (B) Subcellular location annotation of total protein. ER, endoplasmic reticulum. (D) Volcano plot of significant differential proteins between the control and inulin_3 groups (300 g/day per cow). The abscissa is the fold change of protein expression between the two groups; the ordinate is corrected p-value of the difference in protein expression level. PLA2G7, platelet-activating factor acetylhydrolase; GPLD1, glycosyl-phosphatidylinositol-specific phospholipase D; HPD, 4-hydroxyphenylpyruvate dioxygenase; LOC100138645, amine oxidase; IDH1, isocitrate dehydrogenase (NADP); CD44, CD44 antigen; APOA4, apolipoprotein A-IV; FGL2, fibroleukin; SOD3, superoxide dismutase (Cu–Zn); GPI, glucose-6-phosphate isomerase; APOA2, apolipoprotein A-II; CATHL1, cathelicidin-1; SERPINA3-3, serpin A3-3; CTSC, Dipeptidyl peptidase 1; SERPINA3-7, serpin A3-7; SERPINA3-5, serpin A3-5; PIGPLD, phosphatidylinositol-glycan-specific phospholipase D; LBP, lipopolysaccharide-binding protein; HP, haptoglobin; ITIH4, inter-alpha-trypsin inhibitor heavy chain H4.
