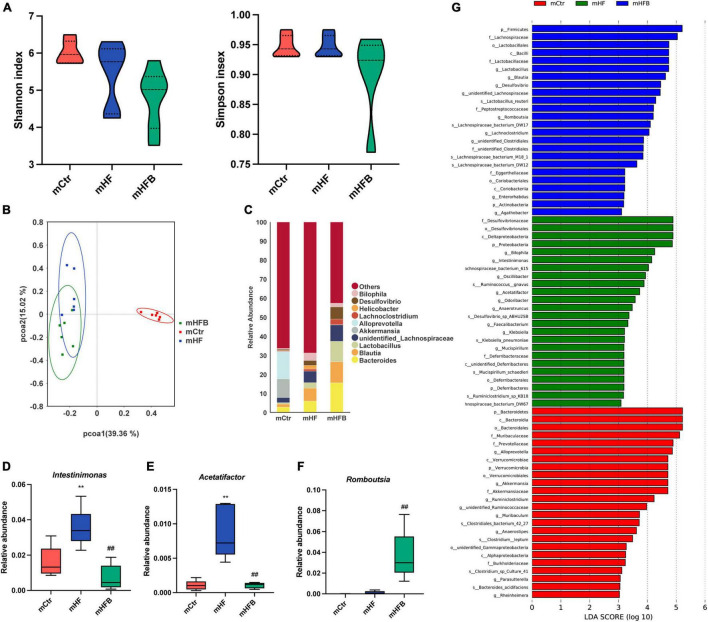
FIGURE 2.
Betaine alters the gut microbiota in high-fat diet dams. The cecal contents were collected from dams after weaning. (A) Shannon index (left) and Simpson index (right); (B) PCoA plots of gut microbiome; (C) relative abundance of the top 10 species at the genus level; (D) relative abundance of Intestinimonas; (E) relative abundance of Acetatifactor; (F) relative abundance of Romboutsia; (G) distinct taxa identified in the three groups using LEfSe analysis. The colors represent the group in which the indicated taxa is more abundant compared to the other group. Ctr, standard control diet; HF, high-fat diet; HFB, high-fat diet with betaine. Data are expressed as means ± S.E.M. (n = 4–6/group). One-way ANOVA; **p < 0.01 vs. Ctr, ##p < 0.01 vs. HF.

